yoUX
All projects

Case study · Fintech

Congrify

From vision to investor prototype.
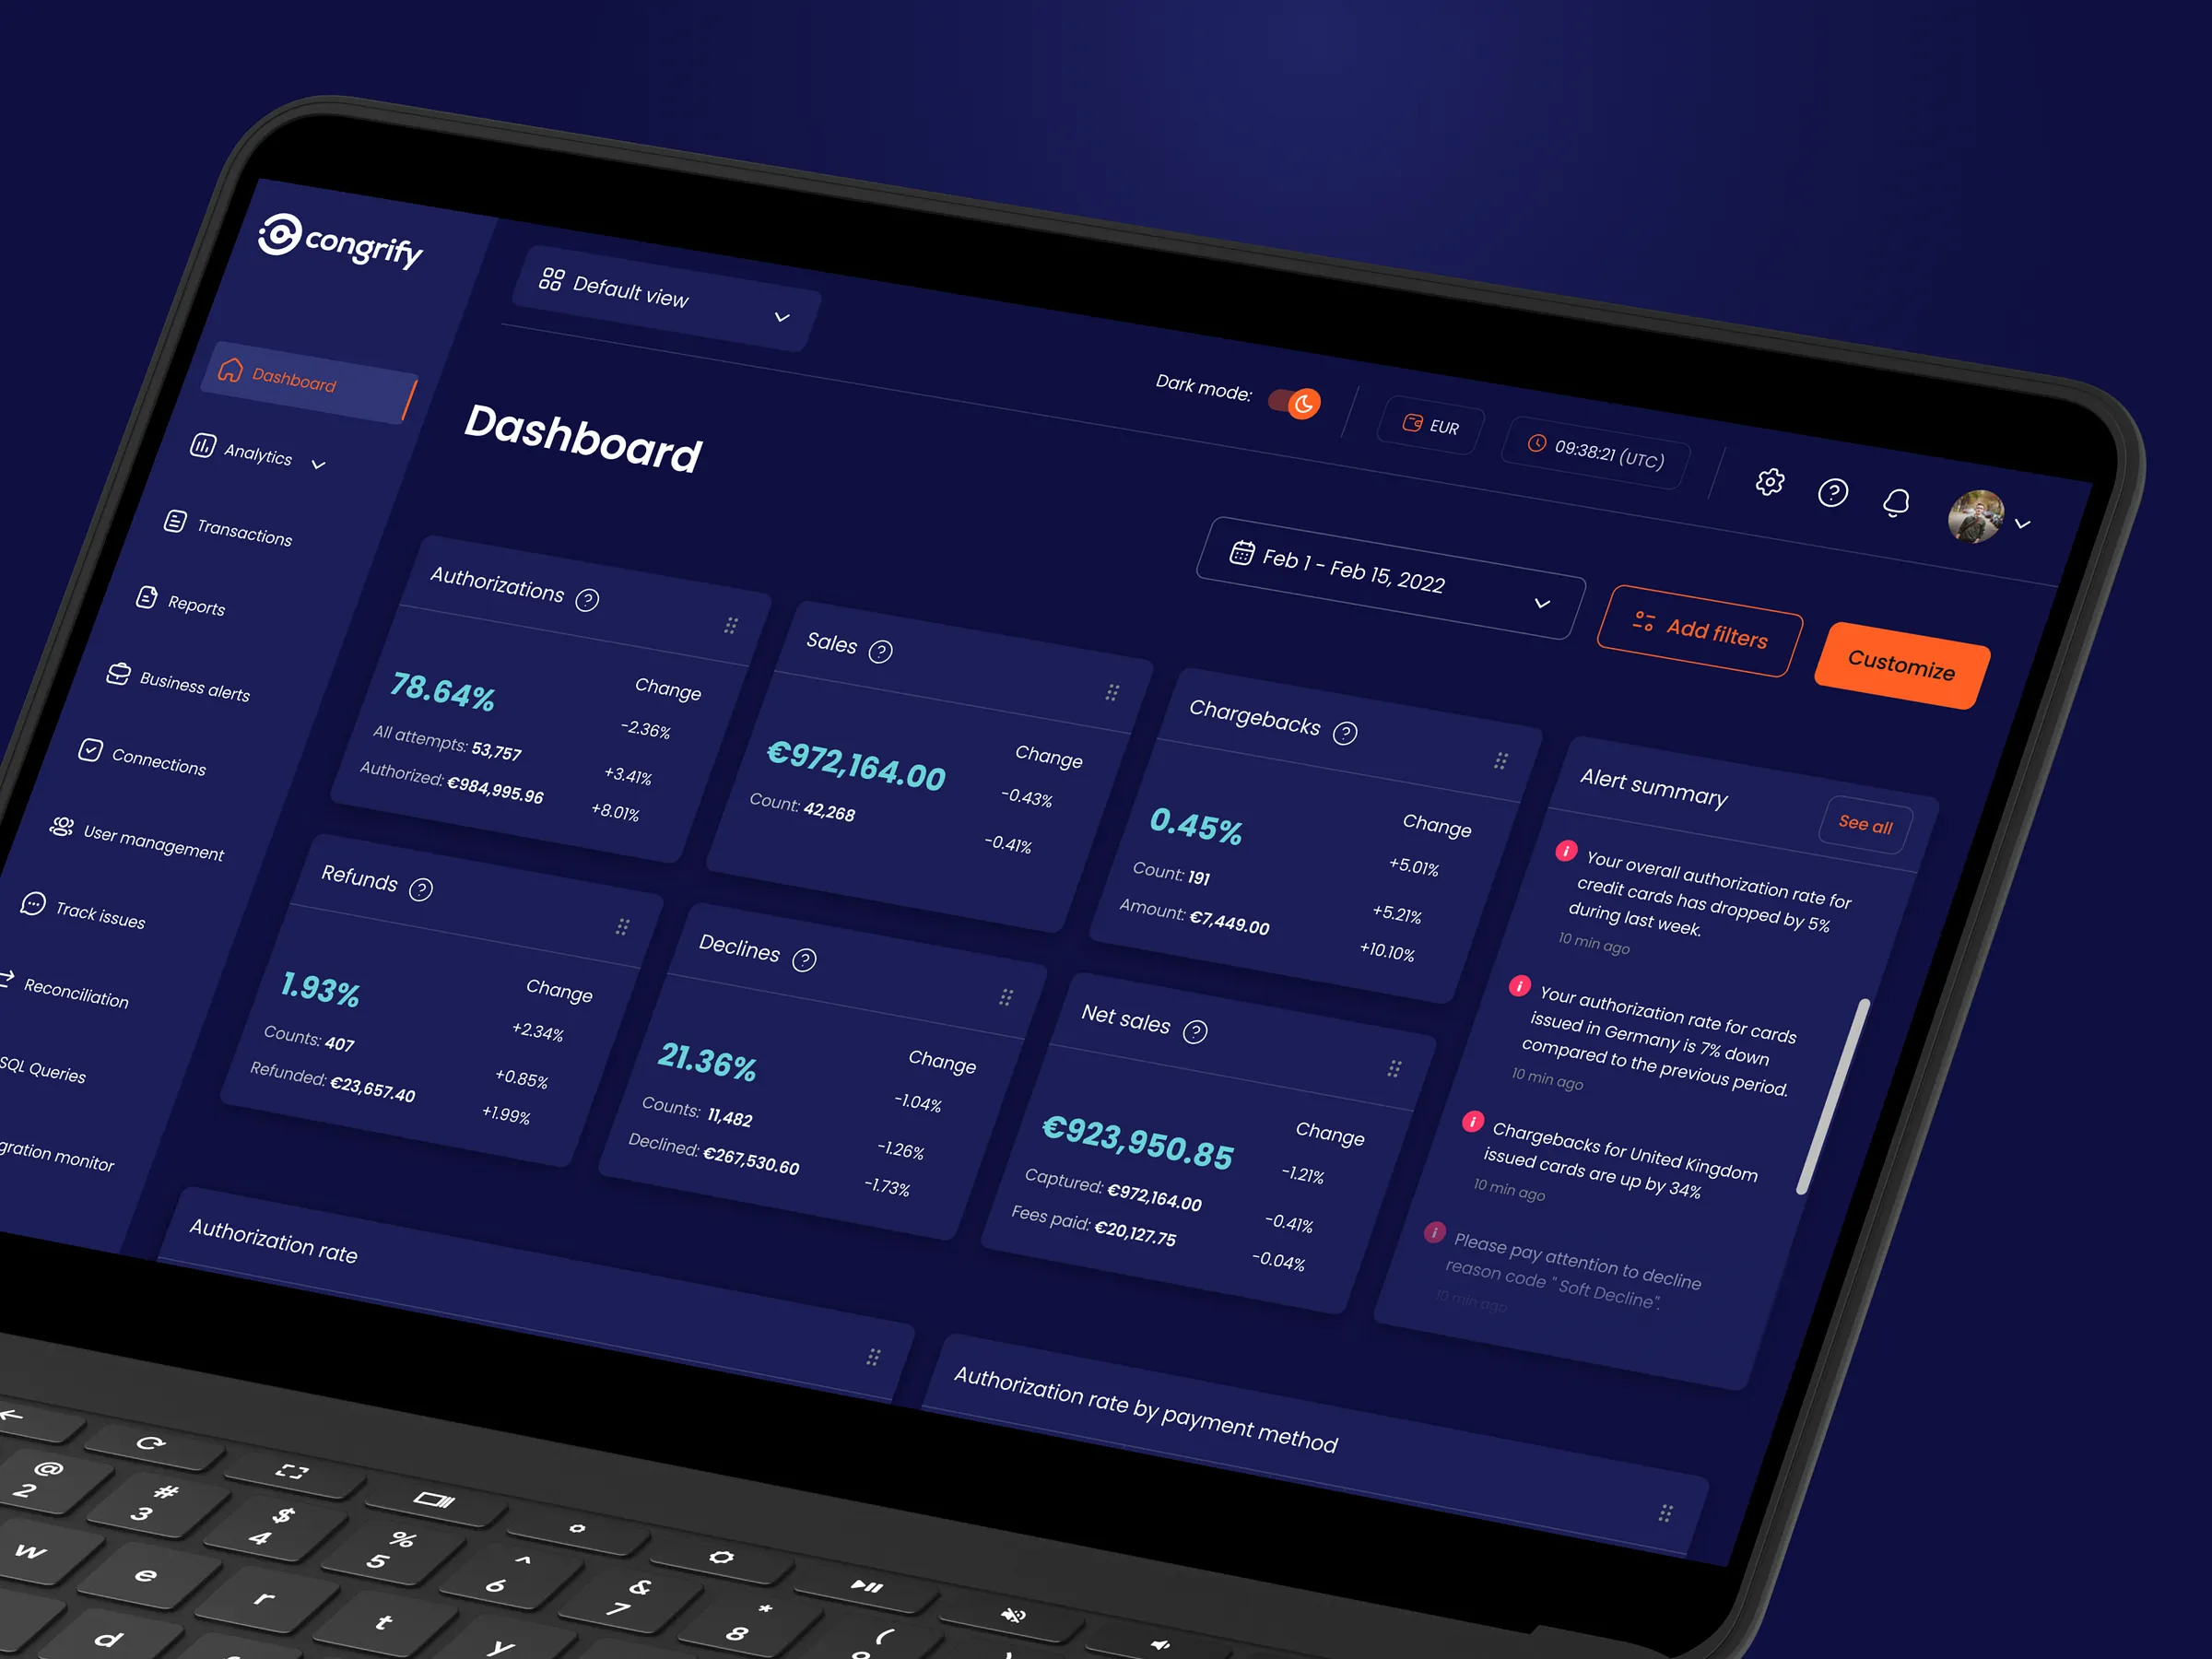
Congrify dashboard — high-fidelity prototype showing payment metrics and alerts

01

Introduction & project context

Product
An advanced fintech platform for payment data consolidation and analysis.
Goal
Create a functional, interactive prototype to secure funding from investors.
My Role
Solo UX Designer & Researcher.

Business Context

The project began with an initial discovery workshop involving the client, a developer, and a Product Owner from our agency. Following this phase, the client decided to continue the collaboration exclusively with me, without the further involvement of a Product Owner. Consequently, I took full responsibility for managing and executing all key project stages.

02

Kick-off workshop & client alignment

Action
Independently organized and facilitated a comprehensive Kick-off workshop for the stakeholders.
Process
Introduced the client to the Human-Centred Design (HCD) framework. Together, we defined expectations, milestones, potential risks, and team responsibilities.
Domain Expertise
The client, acting as the domain expert, onboarded me into the complexities of the payment chain—from payment gateways to chargeback processes.

Guiding principle

“No wireframes would be drawn until we fully understood the users’ real pain points.”

Workshop artifacts

Selected outputs from the kick-off workshop, rebuilt from the original Miro board.

Process description — the HCD cycle

Human-centred design is a fluid and cyclical process. I used the workshop to walk the client through every phase.

Requirements& AuditCustomer &CompetitorResearchContentAnalysis &StrategyInformationArchitectureInteractionDesignUser TestingUI DesignHCD

Key activities, needs, risks & dependencies

We mapped each core team member across four lenses — to align on ownership and surface risks and dependencies early.

Activities

Needs & requirements

Risks

Dependencies

Product Owner

Marco

Coordinating and facilitating when needed.

Prepare meetings, document meetings.

Follow up on tasks.

Timeline and what is needed when, in order to prepare everything with the team.

Create a presentation / flow explaining KPIs and general payment flows.

Provide a list of expected questions.

Time availability.

Doubtful decisions, as we don't have enough data to support them.

Overwhelming amount of information.

Stakeholder

Ronald

Contributing to meetings.

Contributor to open topics and decisions.

Adding too many new topics — need to keep focus.

Stakeholder

Timon

Keep him in the loop. Access to tools and invited to Friday meetings.

UX

Kate

Preparing a synthesized analysis of all information we already have, and what aspects influence IA and wireframes.

Preparing wireframes based on success criteria, potential customer needs and requirements.

Establishing all necessary documents, research criteria and plans, and conducting all elements of user research.

Information about any legal & compliance.

How particular KPIs are counted, how files are analyzed, and how results are presented.

Customers' current questions during the start of the consultancy cooperation with Marco, Ronald and Timon.

Lack of user availability for quantitative research methods.

Changes based on information from the Branding Agency (once we're at an advanced step).

Not sure how we'll be accepting some solutions.

Brand Agency

User availability

03

UX research: interviews & user segmentation

Research
Developed a comprehensive research plan and interview script. I ran structured, ~40-minute interviews with financial data analysts from both small and large companies — anonymized, with a think-aloud approach and no right or wrong answers — to deeply understand their daily workflows and frustrations.

Research goal

Every interview set out to answer the same core questions about our potential audience:

  • Who are they — their company and their role?
  • What does their payment-data analysis process look like?
  • What are their frustrations during payment data analysis?
  • Which information is the most valuable to them?

Sample interview questions

Main questions from the script, each with optional follow-ups I asked only when relevant.

01

How many payment service providers do you use in your company?

  • Could you tell me the names of these providers?
  • Why did you choose them? What was the reason?
  • Why do you use all of them?
  • What do you think about the quality of the data you get thanks to them?
02

What does the payment-data analysis process look like?

  • What elements are you analysing?
  • What do you want to achieve through this analysis?
03

What did you analyze most recently?

  • What was interesting in that data?
04

Based on this analysis, what type of information is the most valuable to you?

05

What problems or challenges do you see with this data analysis?

  • What is the biggest challenge in this analysis?
06

How many people in your company deal with data analysis? How big is the team?

07

What about the frequency of this analysis?

  • How often do you analyze this data?
08

What happens after this analysis, and how do you process the data?

  • What does the change process look like?
09

What tools do you use to analyze the data?

  • Why do you use them?
10

What kind of payment-data analysis system do you use?

  • Why did you choose this one, and how do you use it?
  • What do you think about it? What could be improved?
  • What objections did you have before implementing such a system?
  • If you don't have one — why not?
11

In your organization, who can decide about implementing such a system or tool?

12

Imagine the perfect payment-data analysis process — what would it look like?

Data Synthesis
Analyzed and grouped the findings into 3 core personas.
01
The Beginner

Infrequently analyzes payment data, feels overwhelmed by complexity, and lacks time and resources. They require straightforward, high-level summaries.

Profile

  • Broad range of responsibilities, not always connected with payment processing.
  • They don't analyze data deeply.
  • They track only a few metrics that matter to them — failure rates, source of transaction, gross volume.
  • They are aware that having more than one PSP is important (as a backup).
  • But they rely on the data from those PSPs, and it is sufficient for their needs.
  • They don't have the time and resources to go deeper.
  • They don't have the knowledge of what to look for.
  • The frequency of such analysis is rather rare — around once a week.

Goals & motivations

  • Their goals are not always connected with payment processing.
  • Making sure the company runs well.
  • Finding factors that help the company grow.
  • Reducing the failure rate.

Needs

  • Resources.
  • More knowledge about payment processes.
  • Access to someone with deeper payment-process knowledge — without outsourcing, to keep sensitive data in-house.

Frustrations & pain points

  • Lack of time — a lot of things to do.
  • Payment data analysis feels overwhelming.
  • They are not sure how to deal with this process.
  • Lack of knowledge about the whole process.
  • Lack of knowledge of how to interpret particular elements and what to look for.

Expectations

  • A way to organize data so it's easy to understand, even for people unfamiliar with payment processes.
  • Information and guidelines on how to improve particular elements.
02
The Intermediate User

Frustrated by a lack of standardization—reports from different Payment Service Providers (PSPs) come in completely inconsistent file formats.

Profile

  • Quite advanced user with an understanding of payment processing.
  • Their analysis depends on particular business needs.
  • Responsible for the whole payment strategy — for example, a fraud strategy on a new market.
  • Responsible for building relationships with PSPs and informing them about particular issues.
  • They are present on many different markets.
  • They know that having more than one PSP matters — not only as a backup, but because being present on different markets can force them to use a particular PSP (e.g. for legal reasons).
  • Having more than one PSP gives them room to negotiate better conditions.
  • The choice of PSP depends on how well that supplier can operate on the particular market.
  • They have some infrastructure for storing and processing data.

Goals & motivations

  • Control costs.
  • Standardize their reconciliation process.
  • Understand the impact of each payment method versus its cost.
  • Know which types of payment they have the most of.

Needs

  • Access to the data in real time.
  • More time and resources.

Frustrations & pain points

  • Lack of time versus the scope of work.
  • Suppliers can't provide the information they're looking for in a detailed format.
  • Different file formats across all PSP reports.
  • Lack of resources.
  • Differences between data from different providers.
  • Data format — sometimes additional characters can break the whole report.

Expectations

  • Quick, immediate access only to the components they are looking for.
  • The ability to compare the cost of a transaction across other merchants.
03
The Advanced User

Data analysis is their primary job. They look for deep data correlations (e.g., specific reasons behind transaction declines) and expect real-time automation.

Profile

  • Advanced user with a deep understanding of payment processing.
  • Payment processing is one of the critical areas of their business.
  • Their analysis is deep — they always wonder why something happened.
  • They focus on different metrics/KPIs depending on their business needs — transaction fee, how many payment transactions failed, and why.
  • Responsible for the whole payment strategy — payment processing, commission payment, fraud and loss prevention, etc.
  • They are present on many different markets.
  • A priority: detecting and mitigating failing transactions.
  • Detecting and mitigating fraudulent transactions.
  • They know that having more than one PSP is important — for backup, and because different markets can force them to use a particular PSP.
  • Having more than one PSP gives them room to negotiate better conditions.
  • They have teams that deal with payment processes.
  • They are aware of the limits of the information a particular PSP provides — differences in quality, accuracy, and variety of the data they receive.
  • They are aware that some PSPs are not good at reporting.
  • Payment analysis helps them make the best decisions to reach the highest success rate across all transactions.

Goals & motivations

  • Be sure the payment process works properly and as expected.
  • Understand what's stopping them from having perfect payment processing.
  • Understand trends.
  • Detect and mitigate failing transactions.
  • Detect and mitigate fraudulent transactions.
  • Understand why a transaction has failed.
  • Optimize their processes.
  • Understand where they have losses.
  • Optimize failure rates.
  • Provide a payment experience that meets the standards of the business world.

Needs

  • Access to the data in real time.
  • Access to the data daily, with key metrics.
  • All data processed in a proper way.
  • Quick access to components like rejections, accepted transactions, and reasons for rejections.

Frustrations & pain points

  • Lack of resources.
  • Lack of time to analyze in detail.
  • Being able to forecast cash.
  • It takes too much time for decisions to be made by humans.

Expectations

  • The highest automation possible.
  • Analysis of payment data that automatically informs the decision-making process.
  • Proactive information about a particular issue.
  • Guidance on what to change to get better performance.

04

System architecture & modular interface design

Translating insights to product
The varying expertise levels of our personas directly shaped the system architecture. I designed a flexible, highly modular widget-based system.

Sitemap & content architecture

Before designing a single screen, I mapped the full product structure — the sitemap and content architecture that every later design decision hung off.

Dashboard

Analytics

AuthorizationsDecline AnalysisSales & RefundsChargebacksFees3D Secure & PSD2Cash FlowBenchmarking

Product areas

TransactionsReportsBusiness AlertsConnectionsUser ManagementTrack IssuesReconciliationSQL QueriesIntegration Monitor

Account & support

SettingsHelp & SupportNotificationsProfile

The customization layer

On top of that structure, the modular system flexed to each persona — two very different first impressions of the same product.
For advanced users

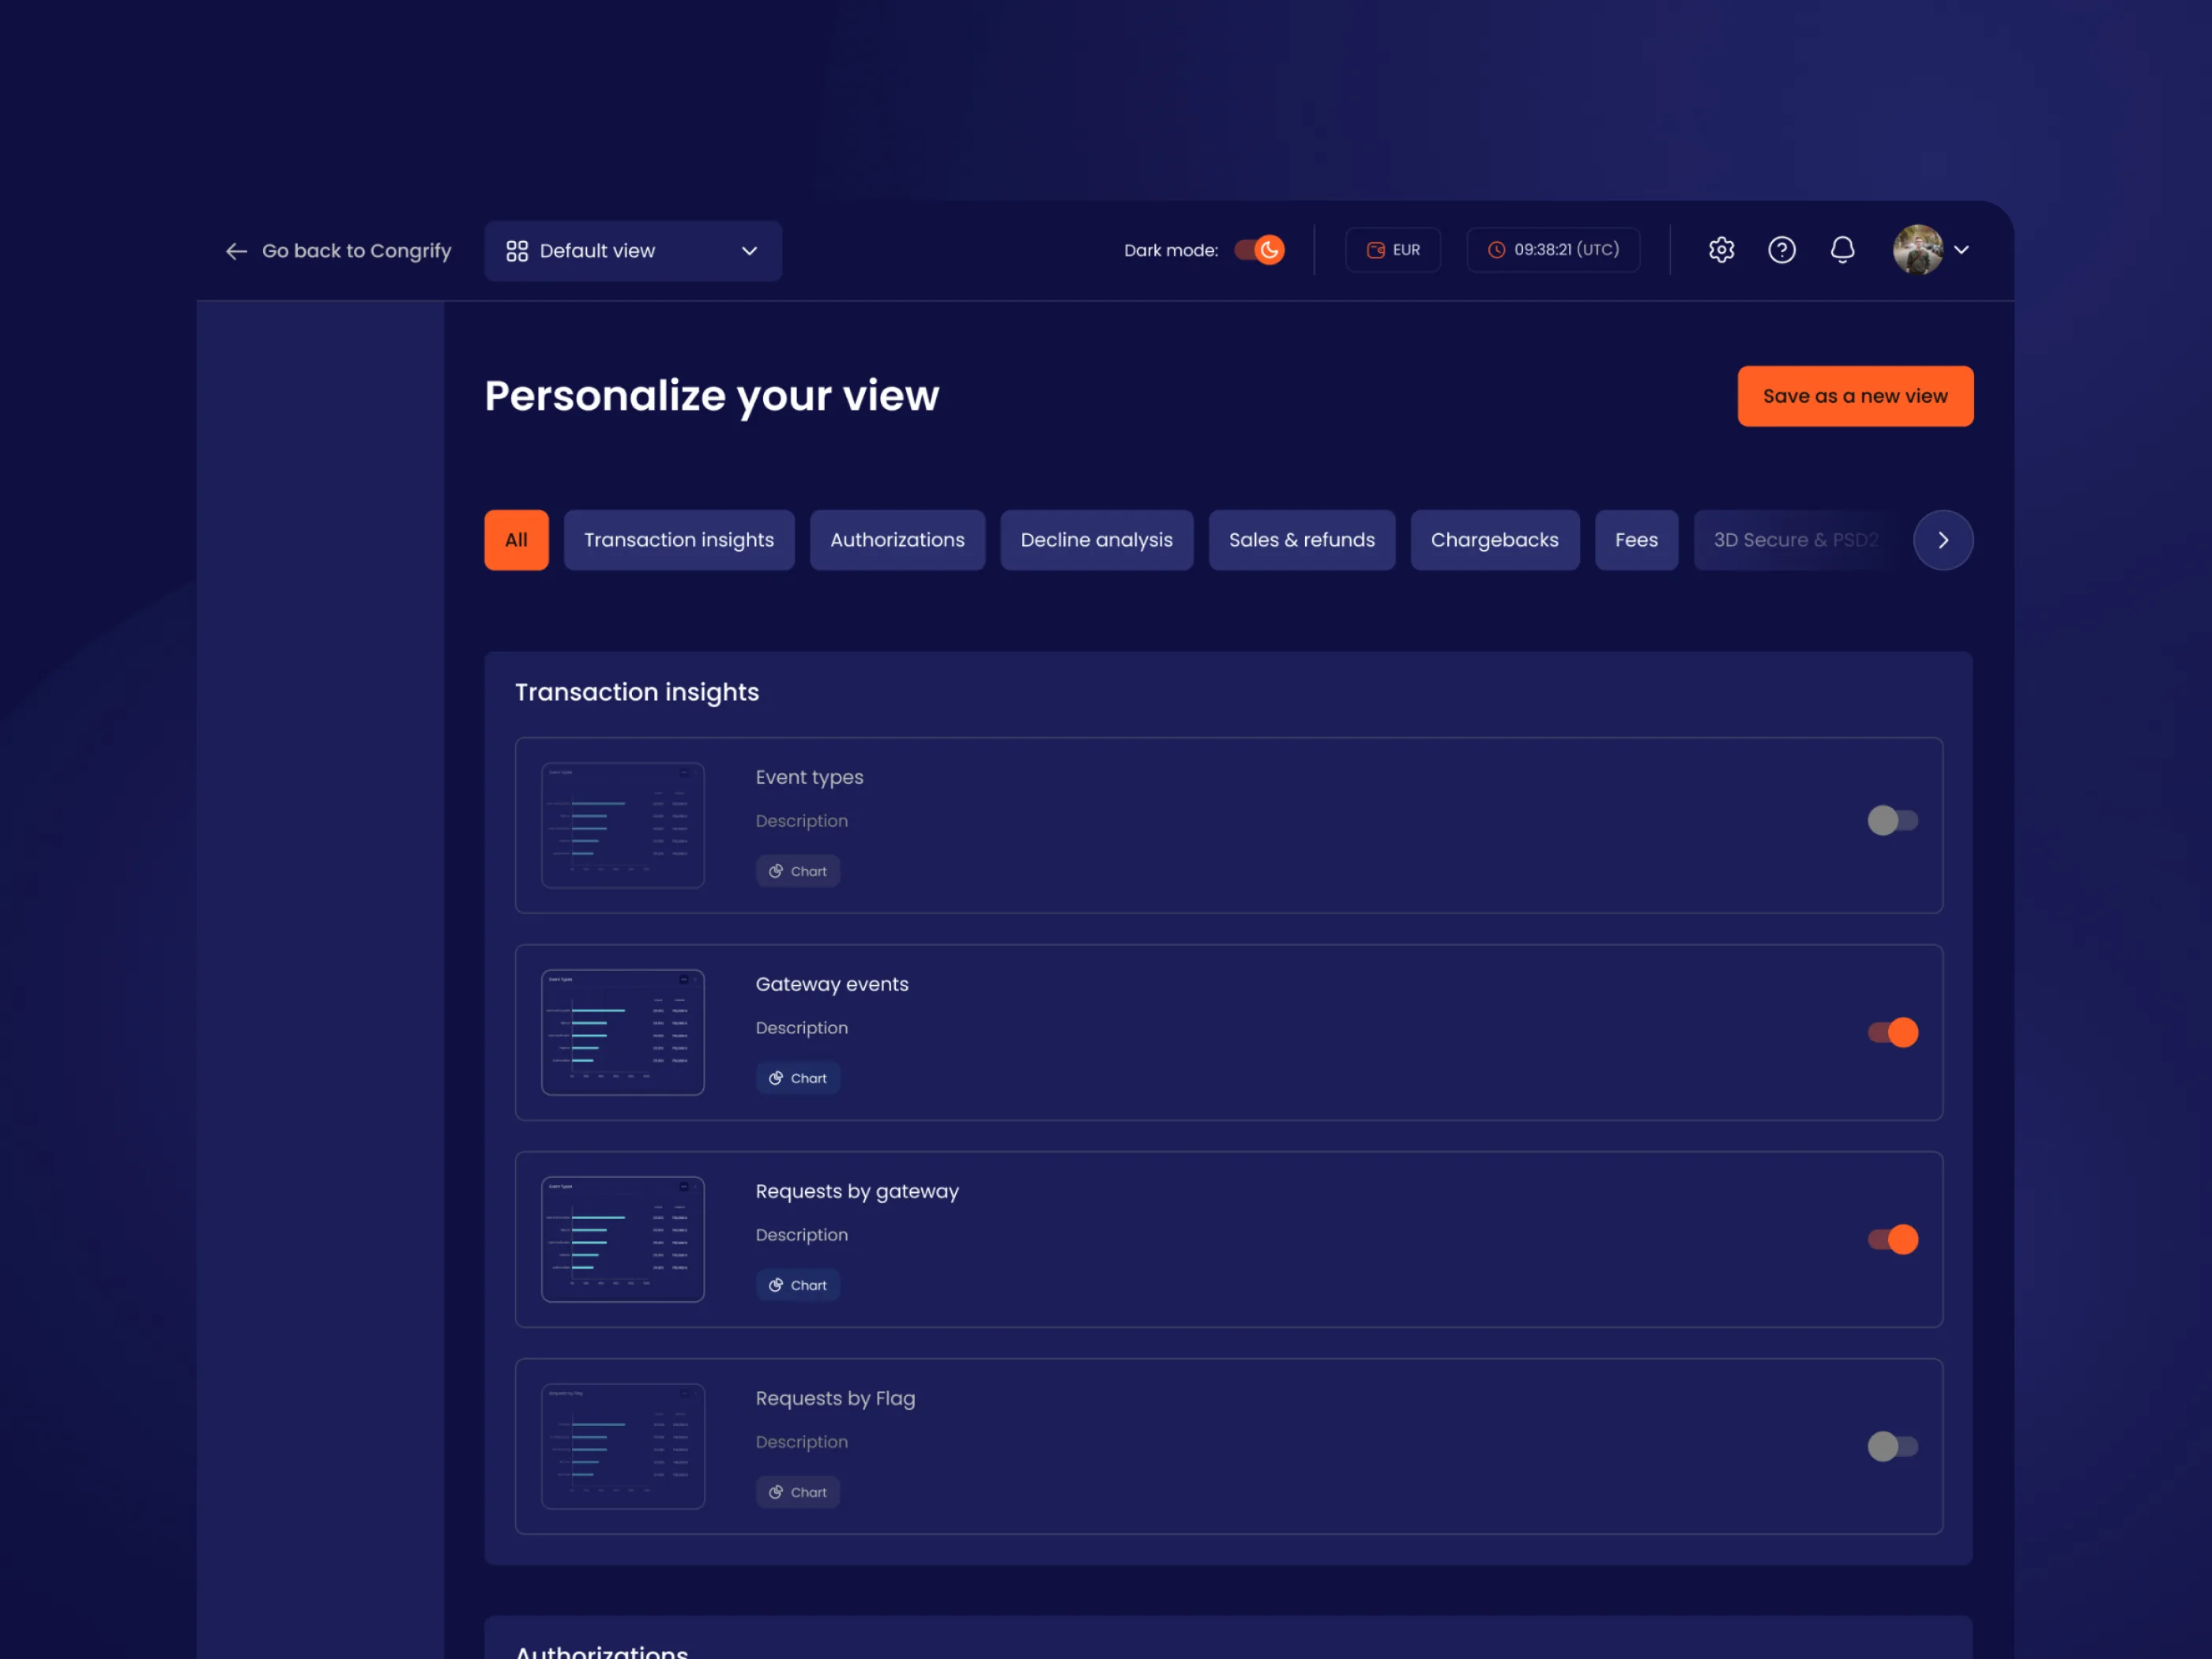
Dashboard Customization

The primary solution to our users' diverse needs was a fully personalizable view (the Customize feature). Advanced users can select, arrange, and configure their own specific metrics.

For first-time users

Smart Defaults

To avoid overwhelming beginner users, the system automatically serves a pre-configured layout of the most critical, easily digestible metrics upon first login.

Congrify 'Personalize your view' screen — users pick and toggle the metrics and widgets shown on their dashboard
The Customize view — advanced users pick, toggle and arrange the exact metrics and widgets shown on their dashboard.

05

Prototyping

The outcome
Delivered a fully interactive, High-Fidelity (Hi-Fi) prototype in Figma that accurately simulated the final product, successfully enabling the client to secure their investment round.

Investment round secured

The prototype gave investors a true feel for the final product — and gave the client the confidence to fund it.

A look at the product

High-fidelity screens from the final Congrify UI.
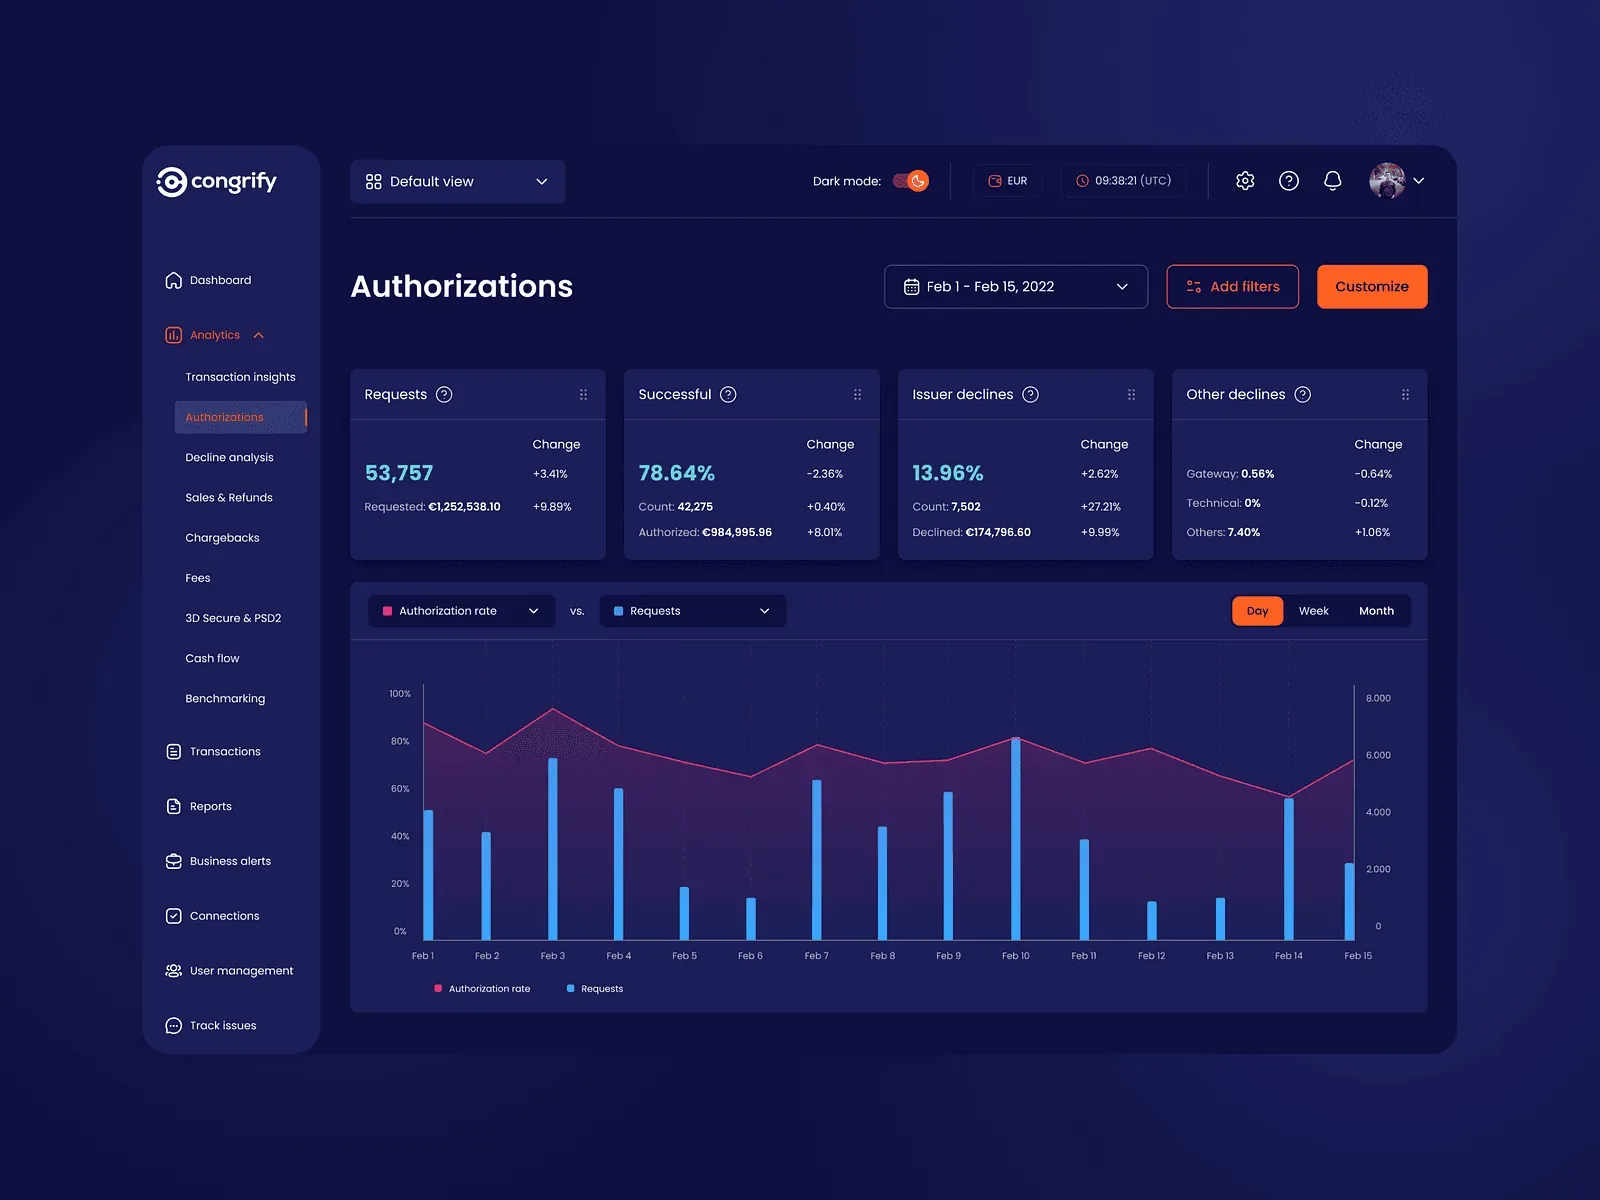
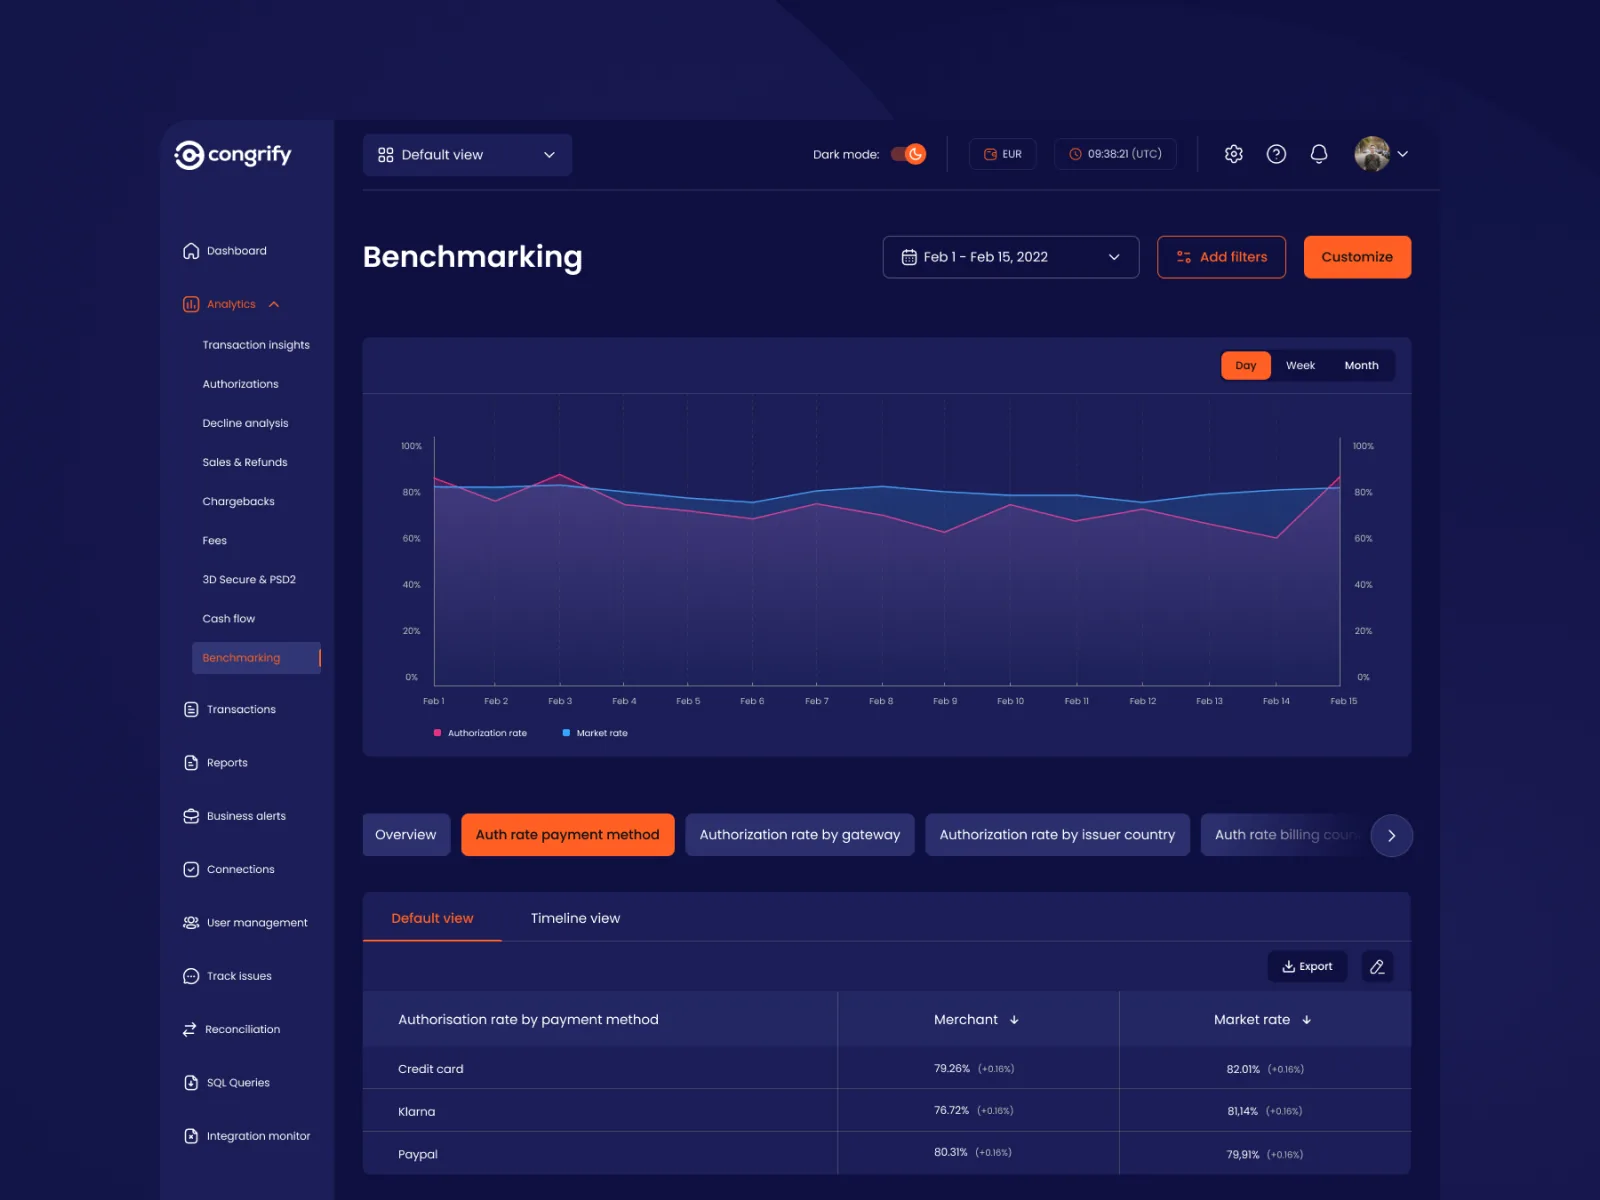
Congrify Authorizations screen — approval rate, declines and request trendsCongrify Benchmarking screen — authorization rates compared against market data

Up next

See all projects

Back to portfolio