Case study · Commodities Trading
AE Markets
An oil-commodities trade management ecosystem.
01
Introduction & complex business context
- Product
- An ecosystem of three integrated B2B systems for a commodity broker — ATOM, Client Portal, and Central User Management.
- Goal
- Digitalize and automate the post-trade process for liquid commodities (crude oil) — reducing errors, optimizing operational efficiency, and securing sensitive market data.
- My Role
- Solo UX Designer & Researcher, leading product design from scratch since 2023.
The challenge
Designing within a highly specialized, complex financial domain with zero tolerance for errors. If the Middle Office misinterprets data and inputs a trade incorrectly onto the exchange, it leads to severe financial penalties and liabilities.
Three integrated systems
02
Domain discovery & collaborative workshops
- Discovery workshops
- The project launched in 2023 with initial scoping workshops, where we mapped out the foundational core modules and business requirements with the client.
- The industry dictionary
- Due to the extremely dense and hermetic industry jargon, the entire team collaboratively built and maintained a living dictionary in Confluence — ensuring flawless communication between product, design, and development.
A taste of the jargon
03
Rapid wireframing & initial hypothesis
- The initial concept
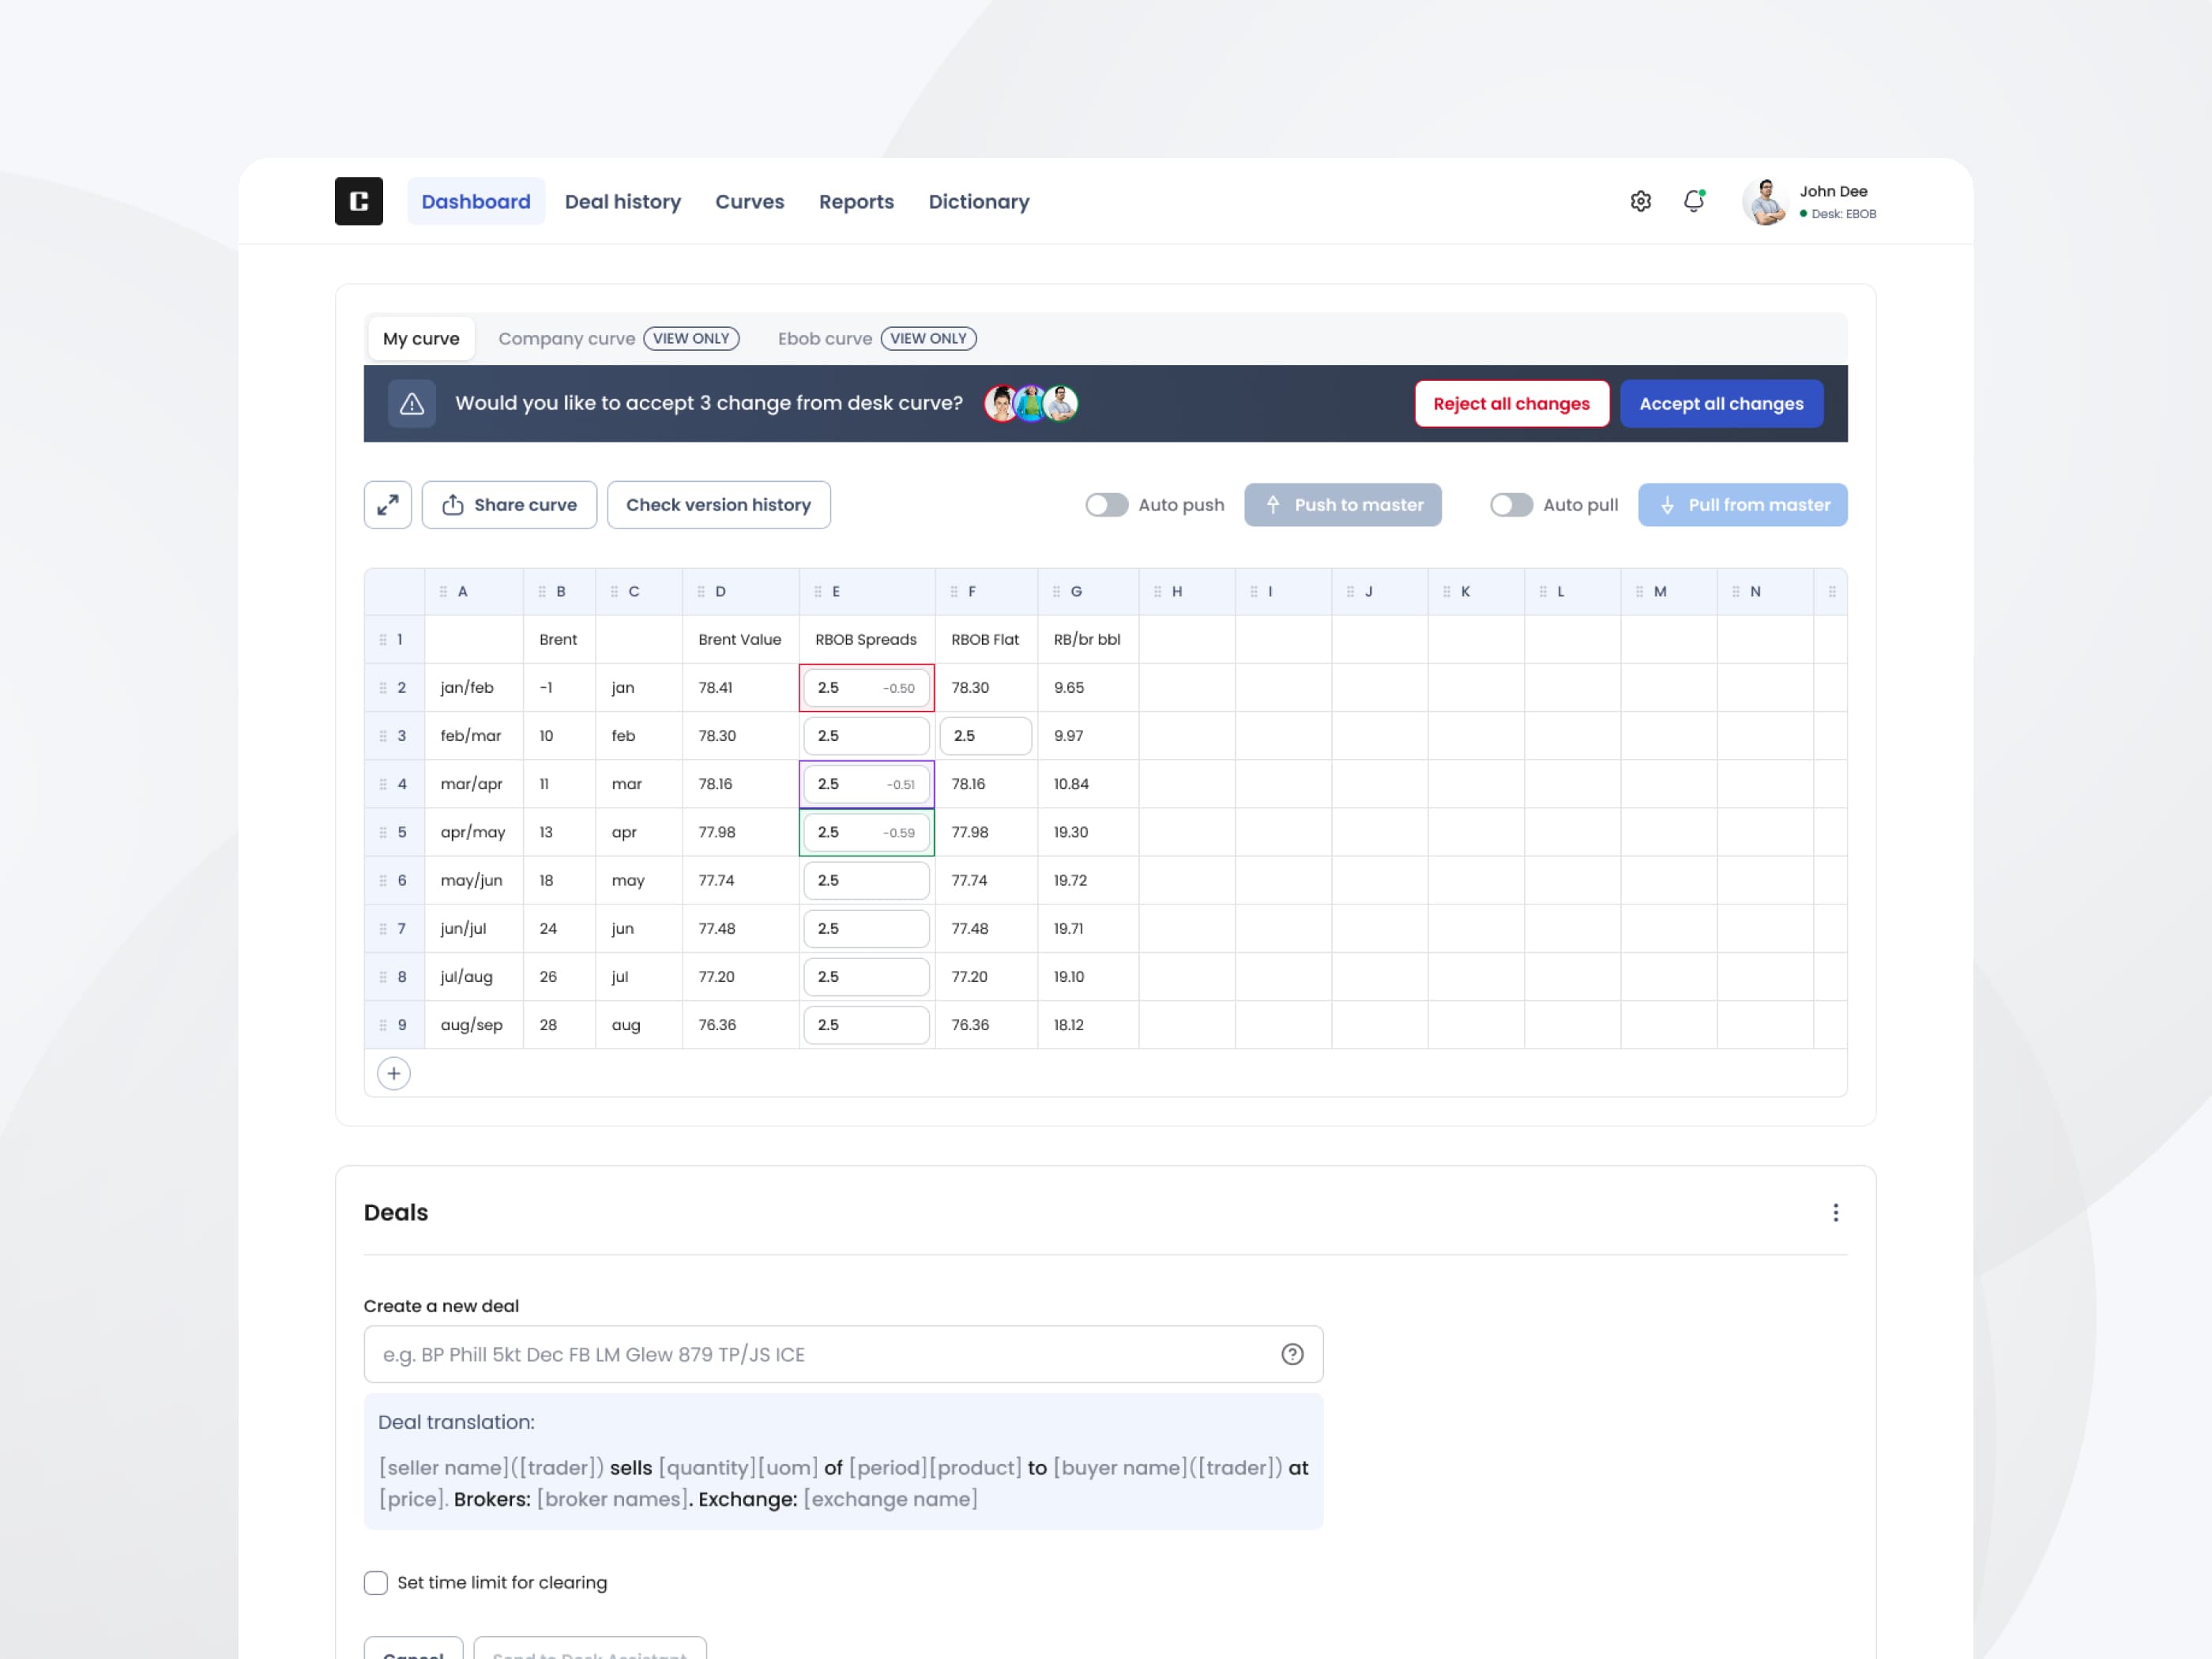
- The initial business premise was to deeply integrate the core analytical modules (price curves) directly into the broker's fast trade-entry screen — housing everything in a single, unified view.
- My approach
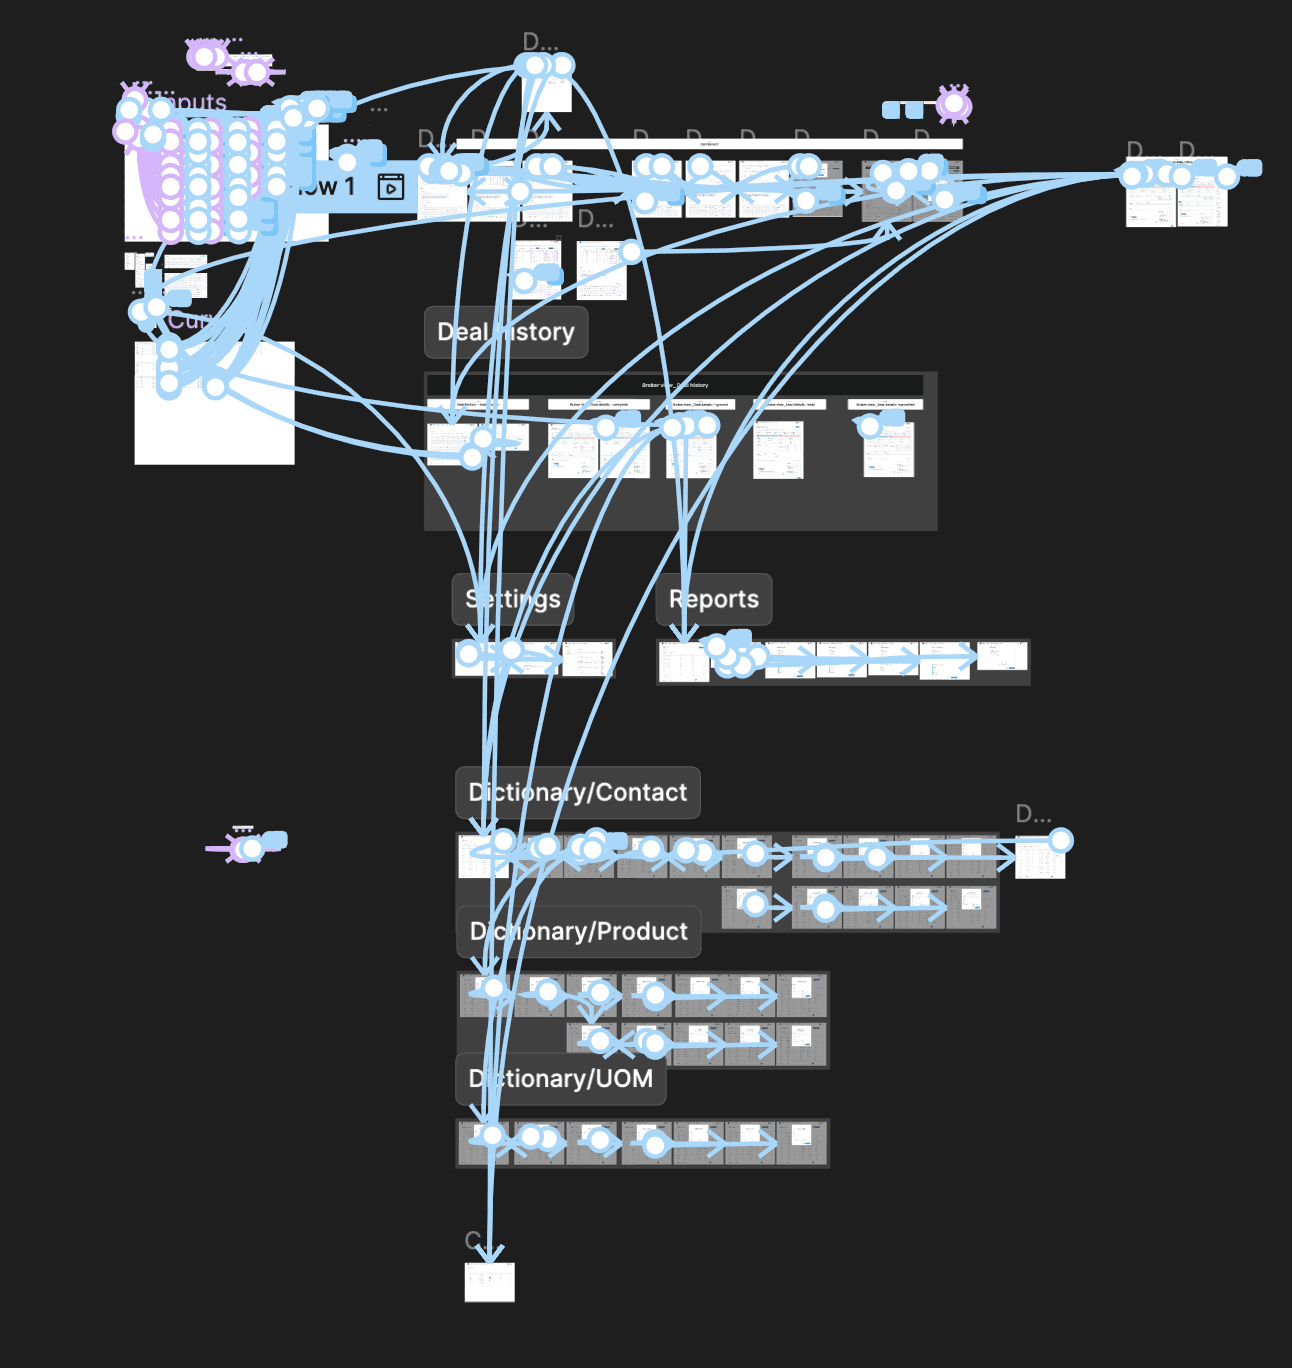
- To validate whether I correctly understood the intricate transaction logic, I created rapid wireframes and an interactive prototype to instantly put this layout to the test.
How prototypes were built back then
Before dedicated prototyping tooling matured, individual Figma screens were wired together by hand with the Prototype feature to simulate the full transaction flow.
04
UX research: usability testing with financial experts
Commodity brokers are incredibly busy users operating under constant time constraints. To capture their focus, we conducted usability tests with a fully interactive, data-dense prototype centered around their real tasks.
Sample research questions
Each session opened with a warm-up interview, then moved into task-based testing on the interactive prototype.
Warm-up interview
Let's start at a high level. I'd love to learn about your work as a broker / DA. Would you please tell me about it?
How would you describe your daily routine?
What were your primary responsibilities in that role?
What are the primary challenges you face in your role?
Usability test — prototype tasks
A few example tasks from the session — not the full script.
Understanding the system
- Tell me a little about your reactions to this screen. What do you think it is telling you?
- What can you do from here?
- What do you think will happen when you do that?
Curves section
- How do you understand the "Push to master" button? What do you expect to happen when you click on it?
- How do you understand the "Pull and save" button? What do you expect to happen when you click on it?
Key user insights
The Broker
Enters complex transaction formulas in their own unique way.
- Works across multiple monitors and frequently minimizes windows.
- Every broker structures transaction formulas differently.
The Middle Office
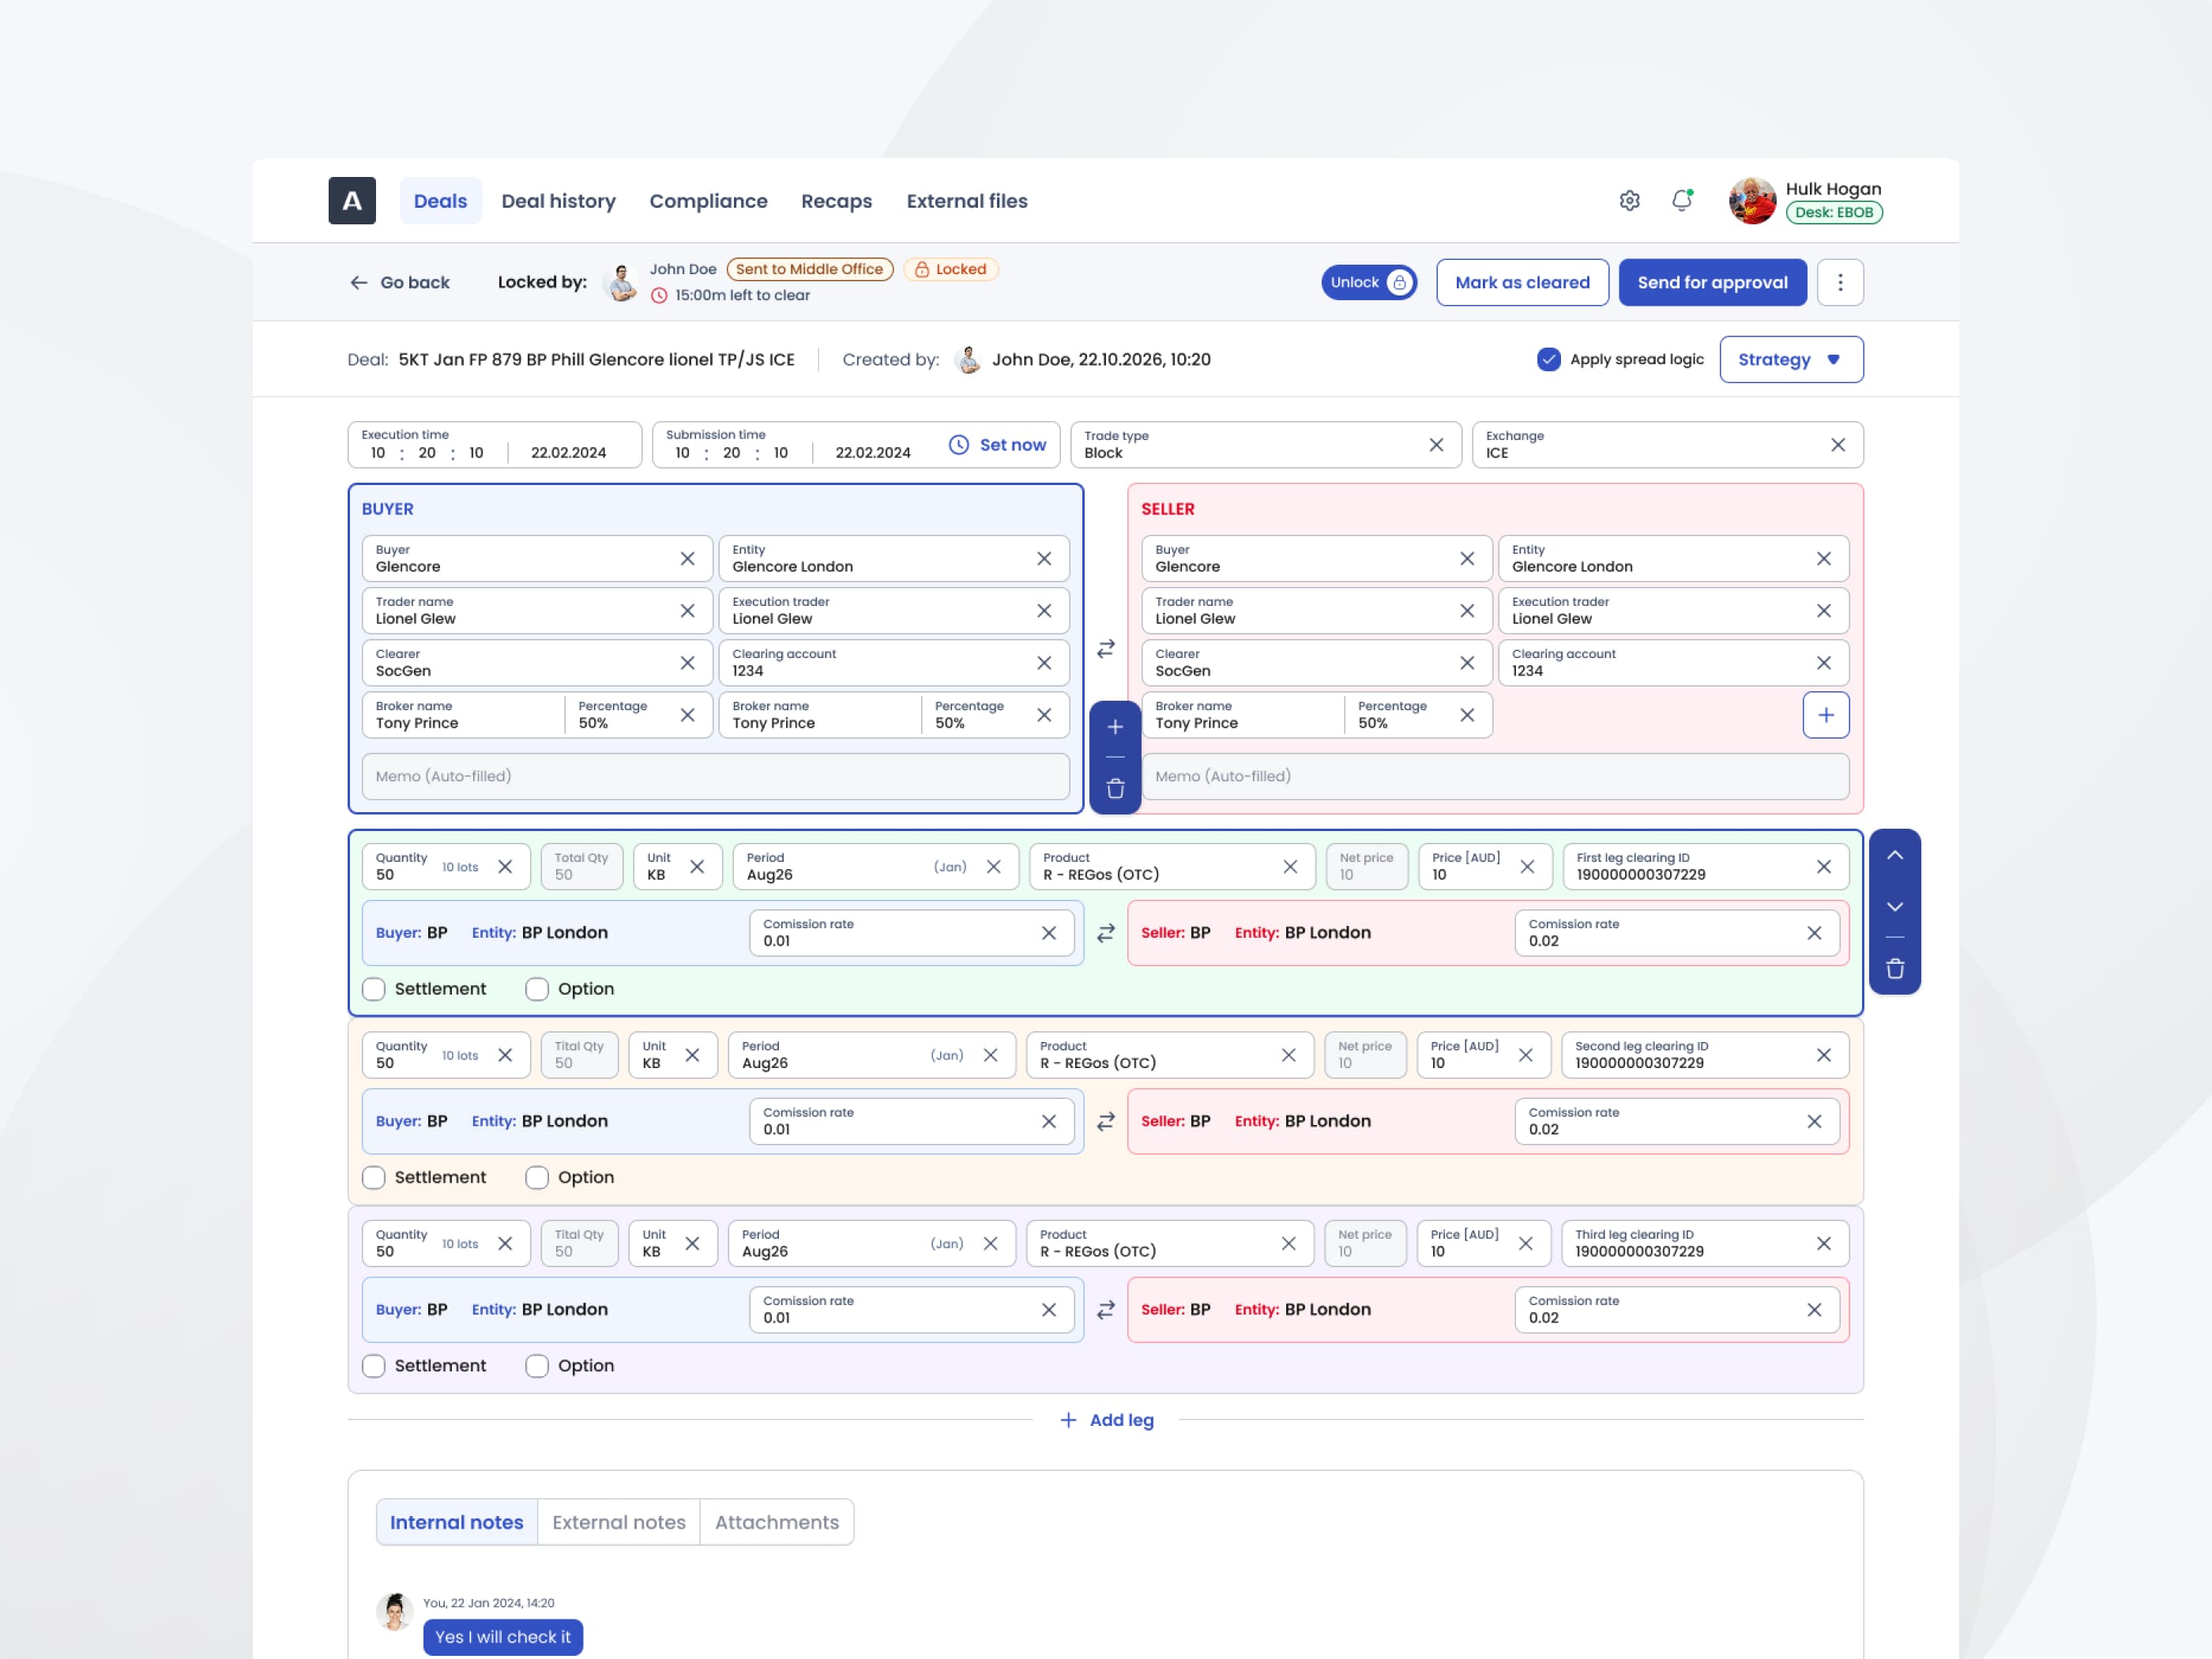
Their primary job is entering deals onto the exchange — so the deal details view is their real workspace.
- Must always see the deal's original raw formula, exactly as typed by the broker.
- A misread formula entered incorrectly onto the exchange means severe financial penalties.
- Critical that as much information as possible stays visible on a single screen, without scrolling.
05
Strategic pivot & system decoupling
- The business decision
- Based on the strategic clarity gained through prototyping and technical alignment, the client made a pivotal decision to fundamentally split the architecture. The curves module was entirely removed from ATOM, allowing it to remain a distraction-free deal management system for the Middle Office.
- A new product
- The analytical charts and price matrices were decoupled into a standalone platform — the Client Portal.
- A new user group
- The Client Portal introduced a brand-new persona — the Trader (the broker's end-client). The UX challenge shifted to extreme flexibility: every Trader has vastly different analytical habits and their own way to arrange views.
06
Client Portal: designing the modular dashboard
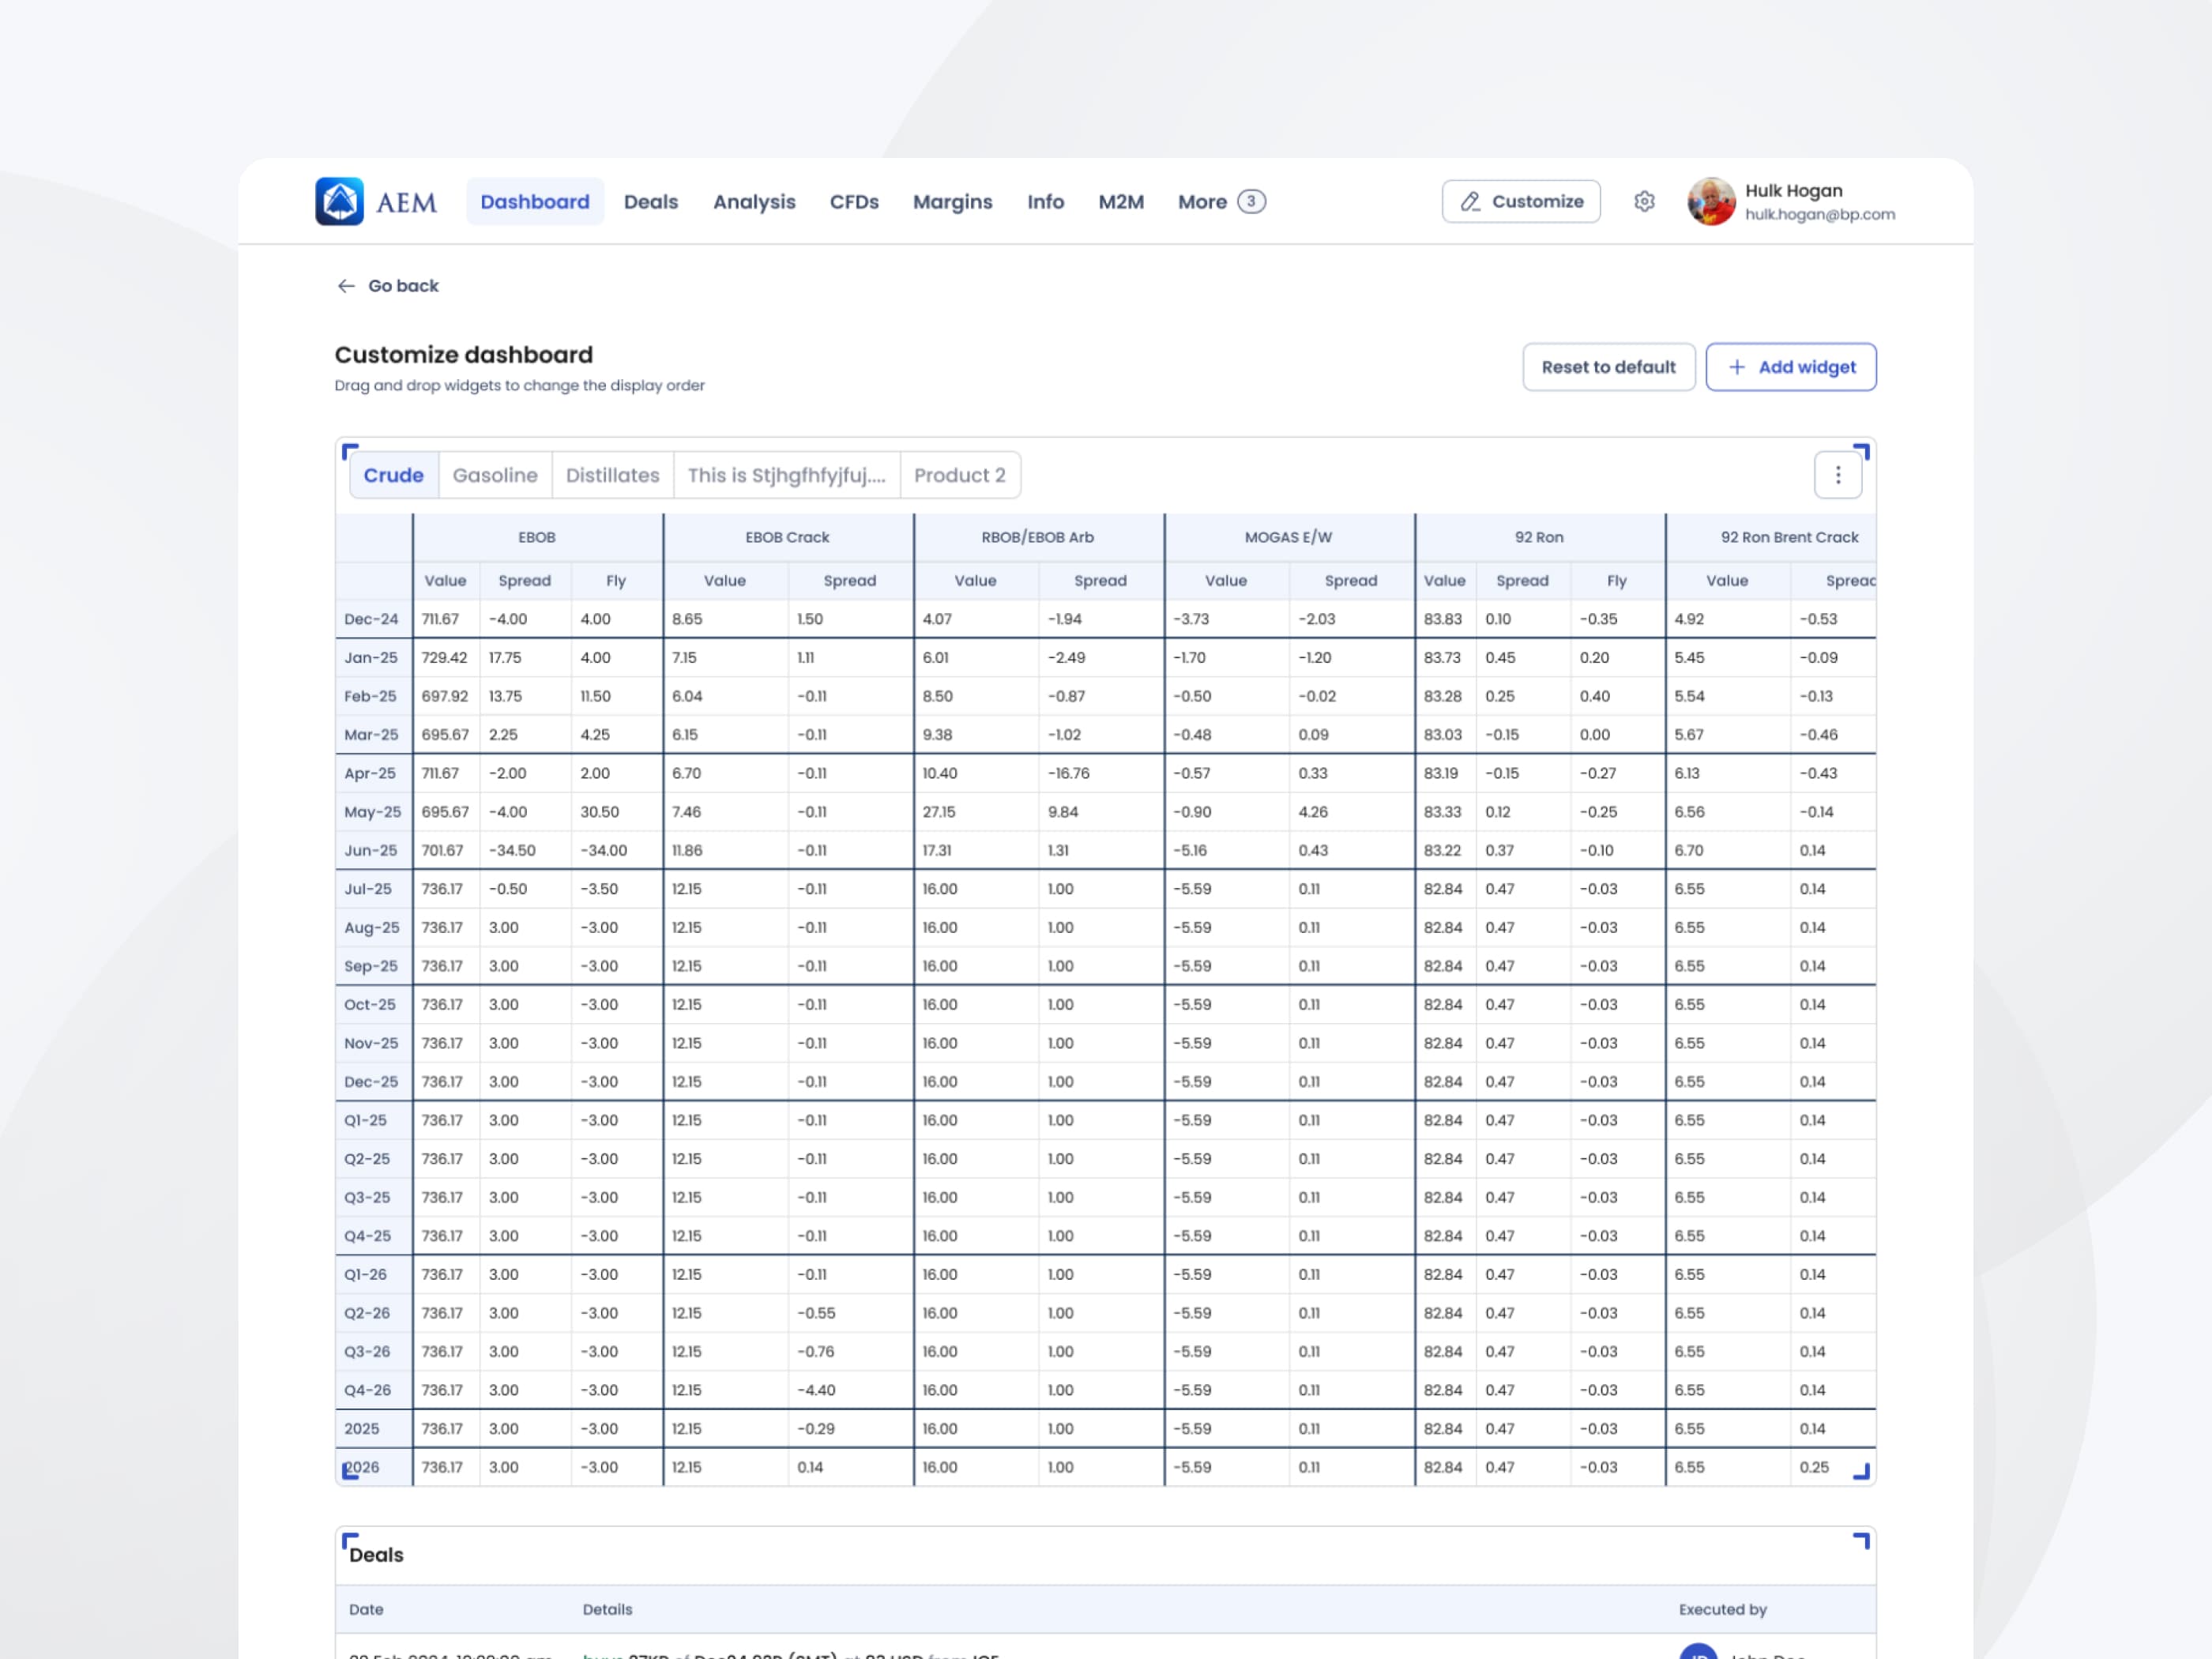
The UX solution
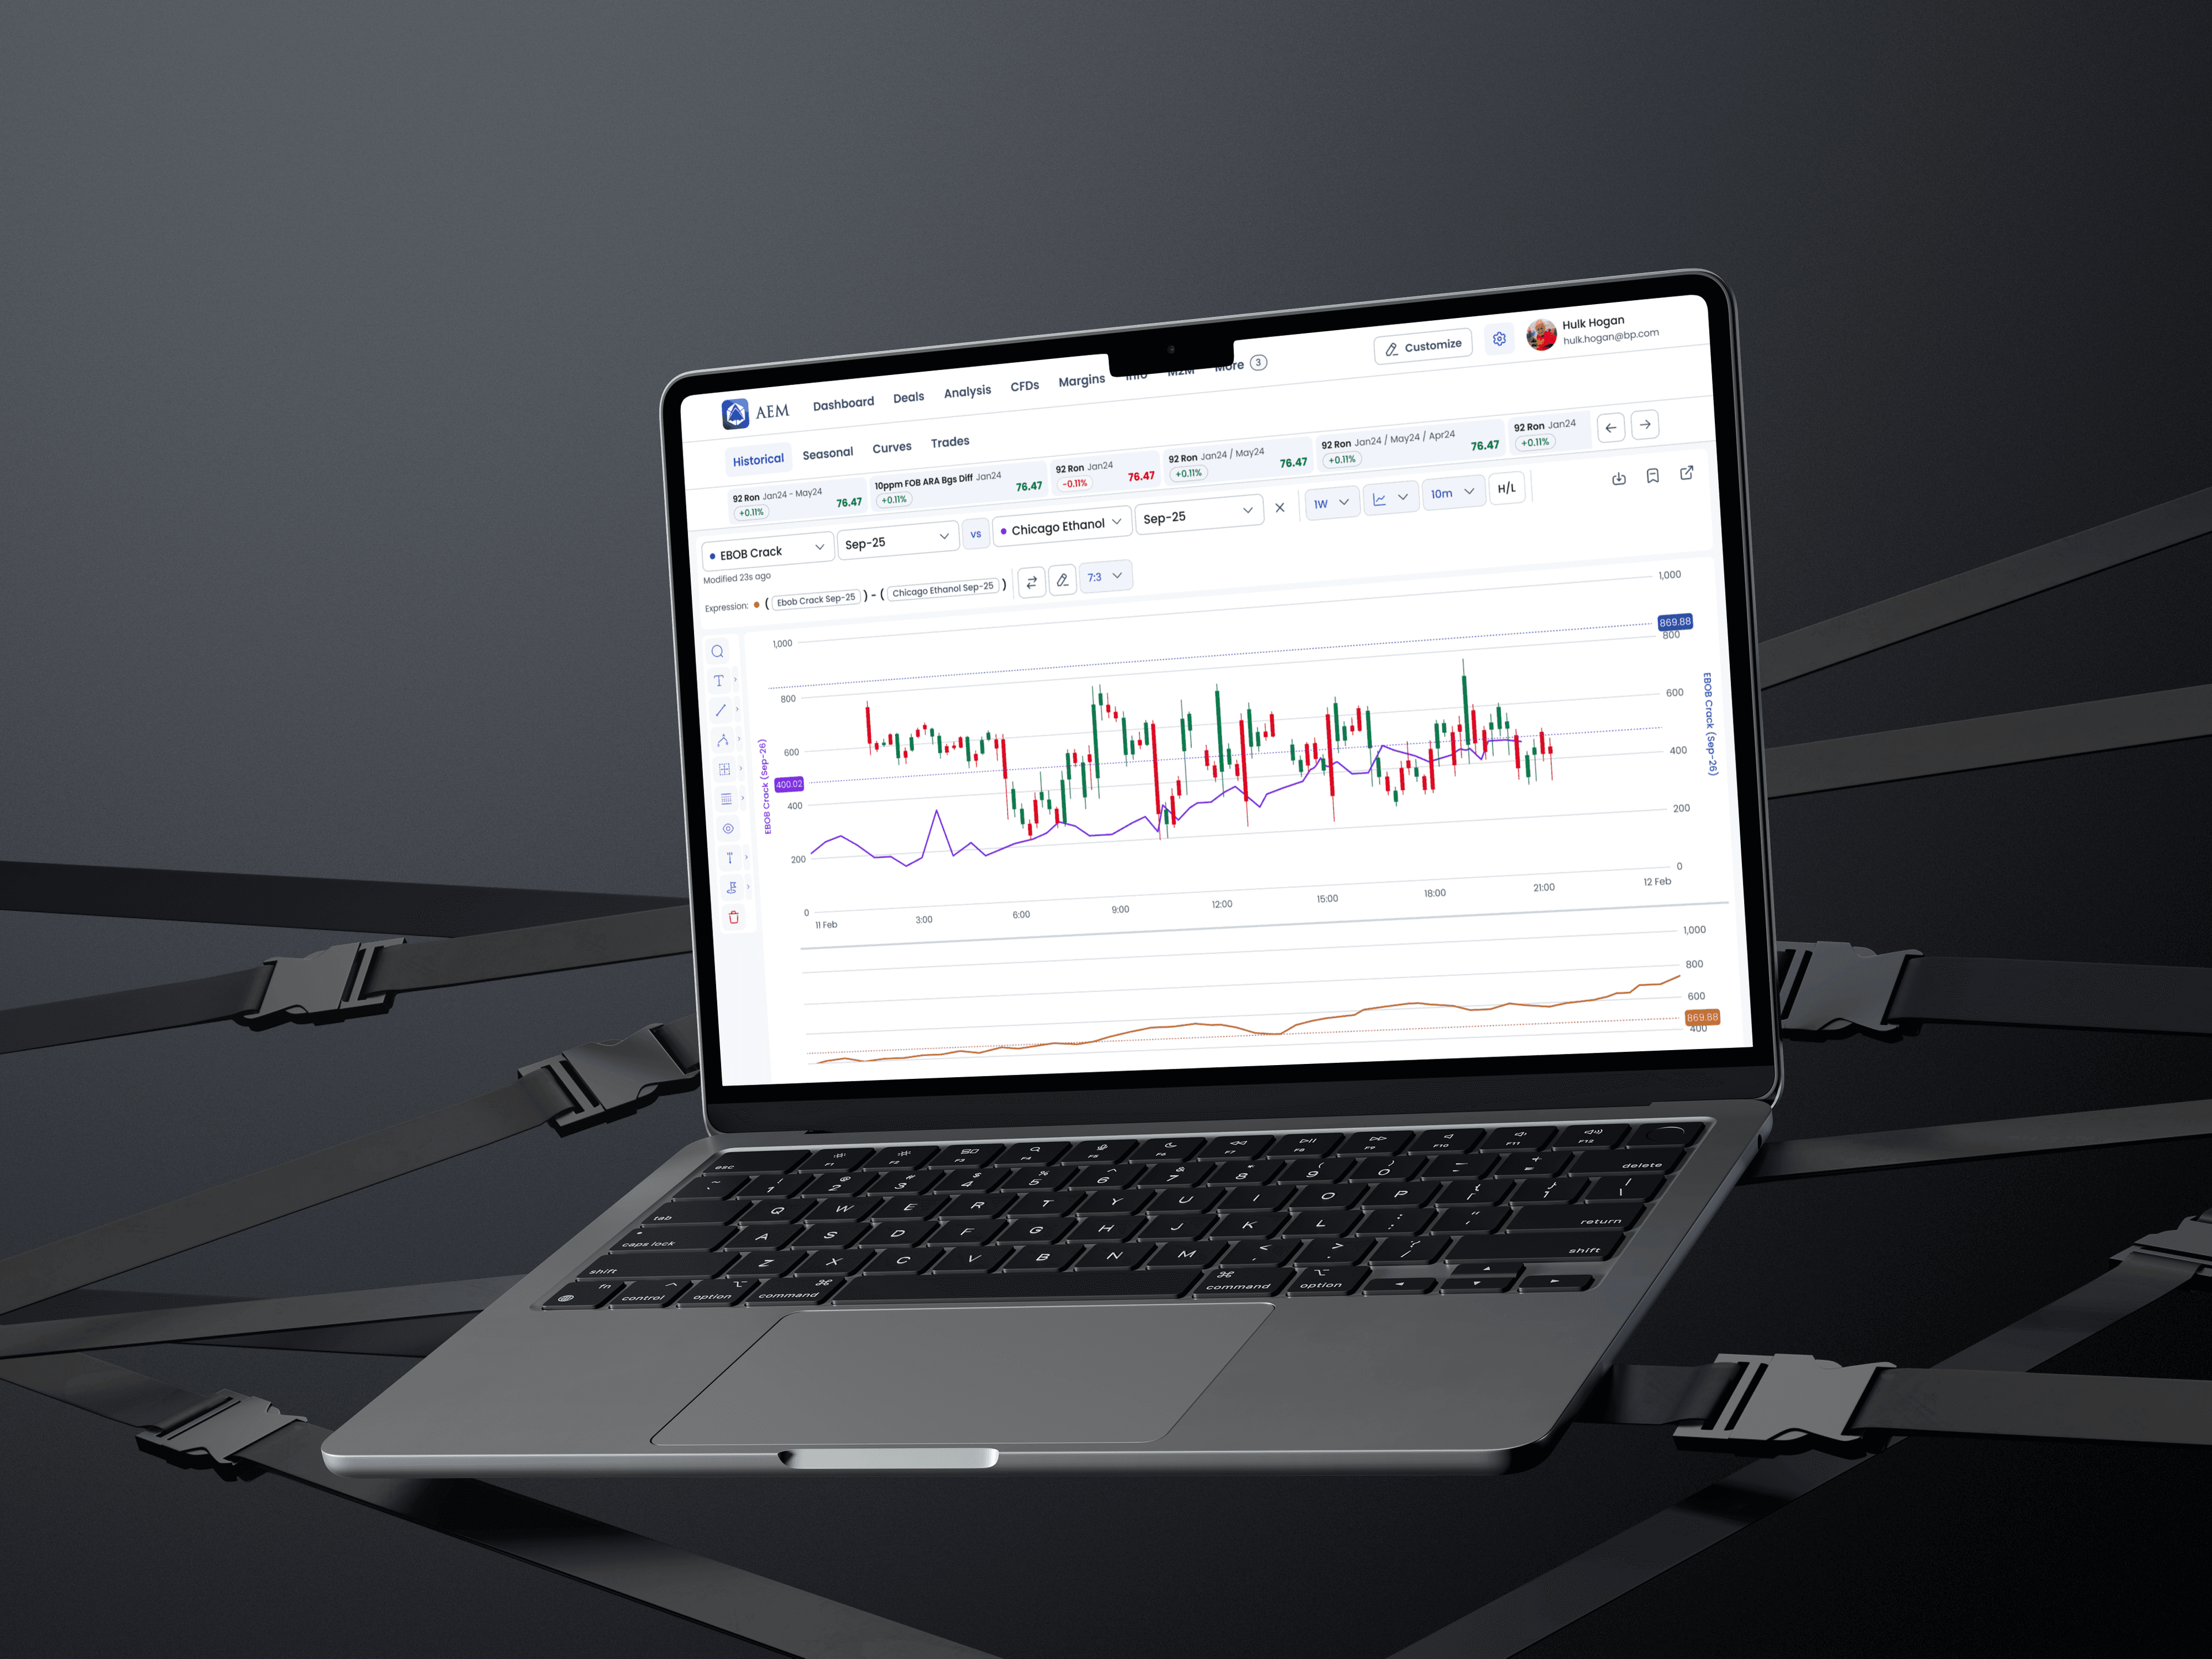
I treated every single dashboard element as an independent, intelligent widget. I architected a fluid layout engine where users can freely choose which widgets to display, dynamically resize them, and drag them to any position — empowering each Trader to build a personalized command center.
07
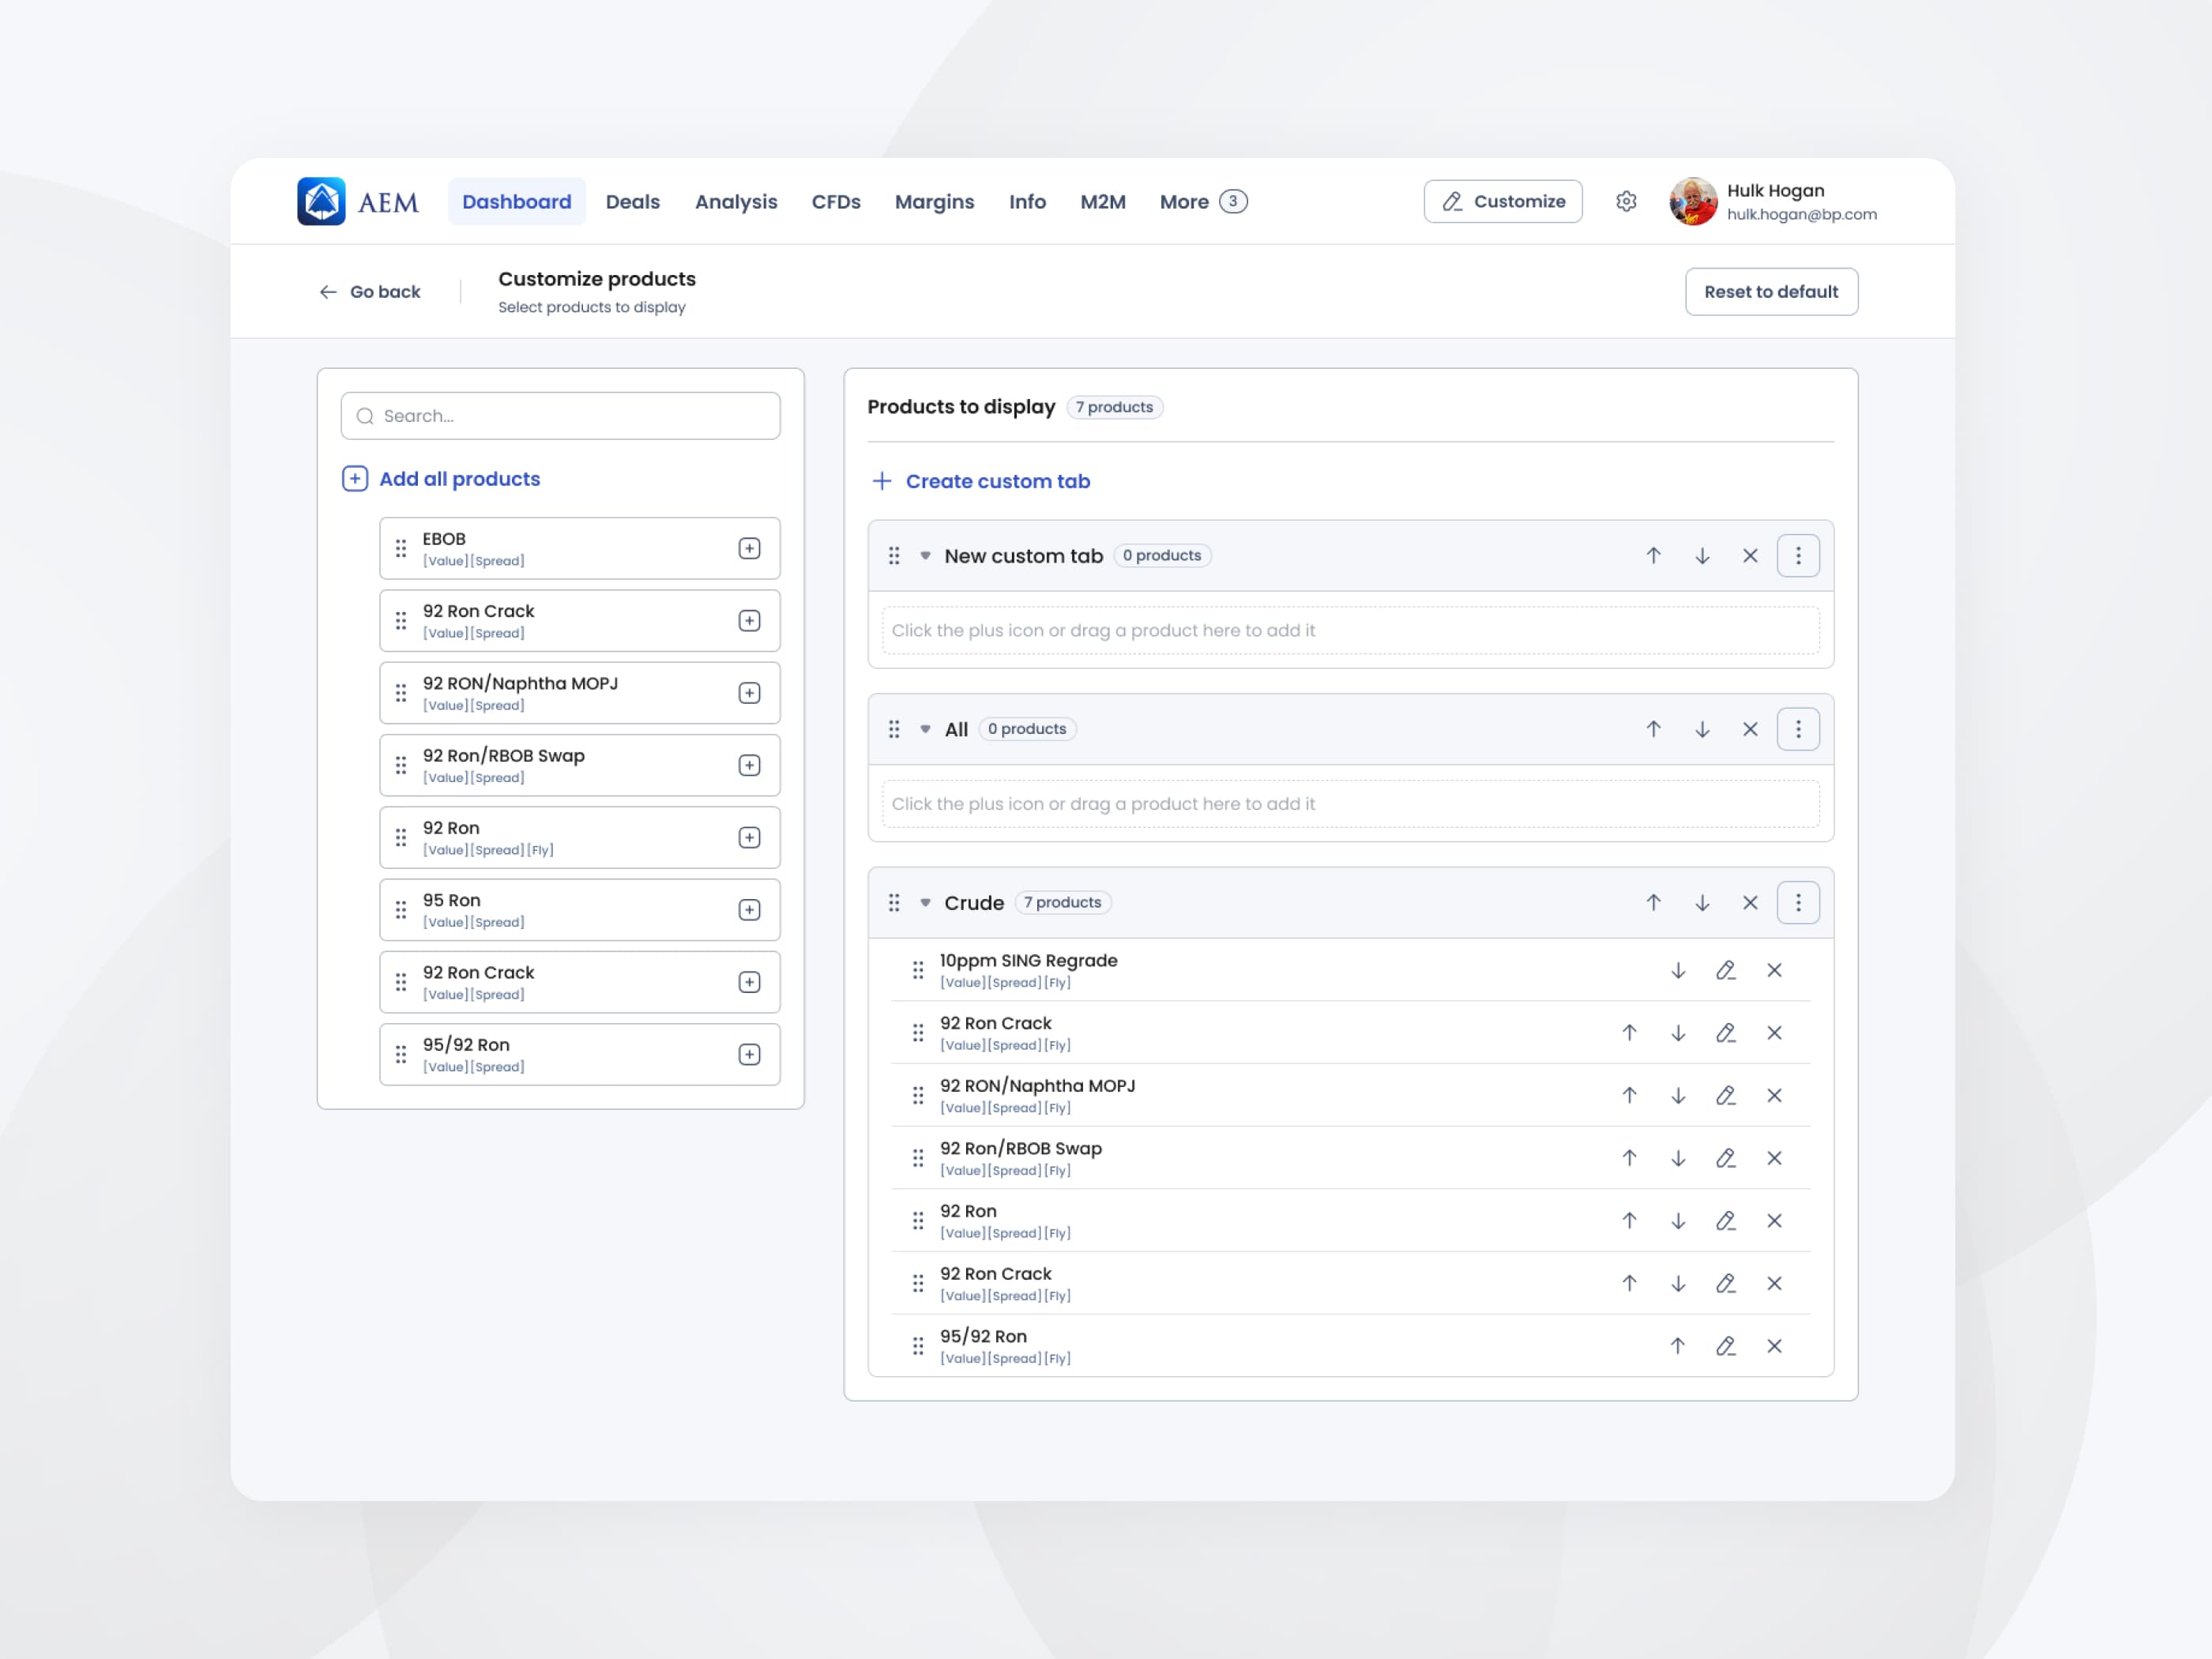
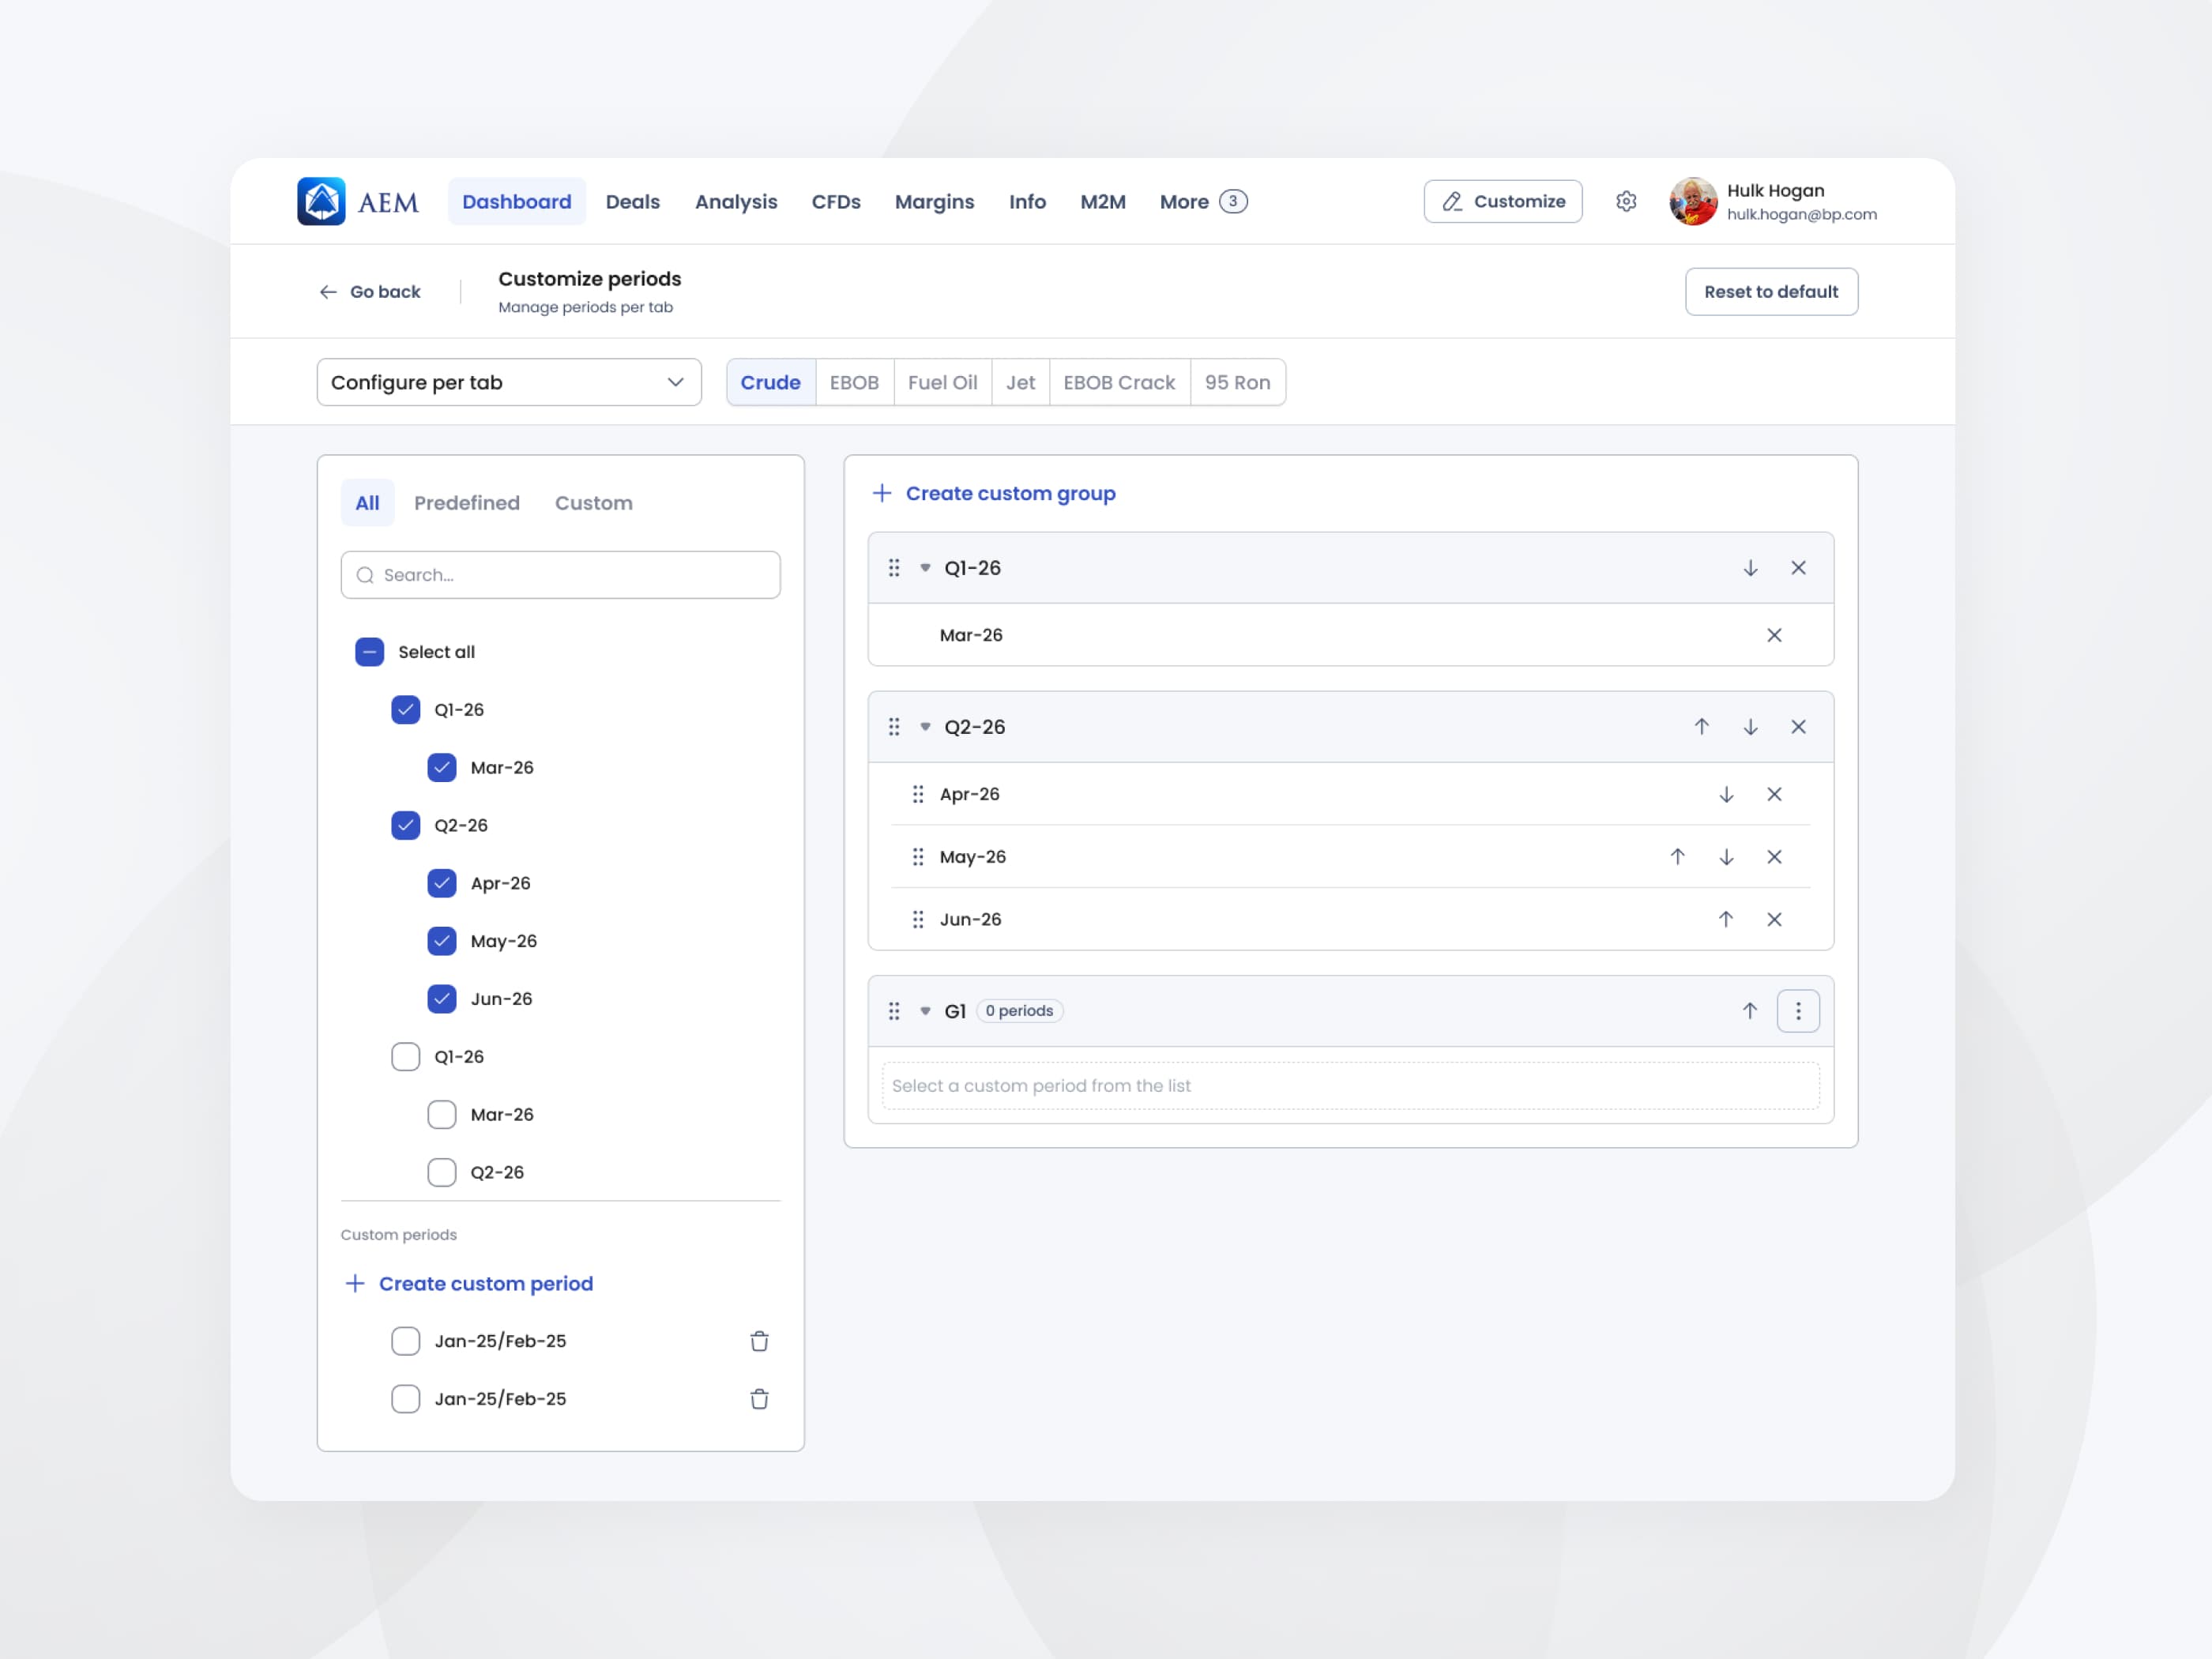
Advanced data customization: pricing curves
Market forward curves operate on highly complex multidimensional data arrays. To make this actionable, I designed an advanced view creator split into two key mechanics.
08
Iterative evolution, on-site collaboration & system scaling
- On-site validation
- The ecosystem consists of living, breathing platforms. I regularly travel to the client's headquarters for on-site workshops, running direct syncs with brokers, traders, and the MO to harvest live feedback.
- Designing for new roles
- When we needed to introduce views for Compliance Officers, I prepared early-stage concept prototypes and carried out deep, qualitative interviews to align the product with strict trade auditing and risk management workflows.
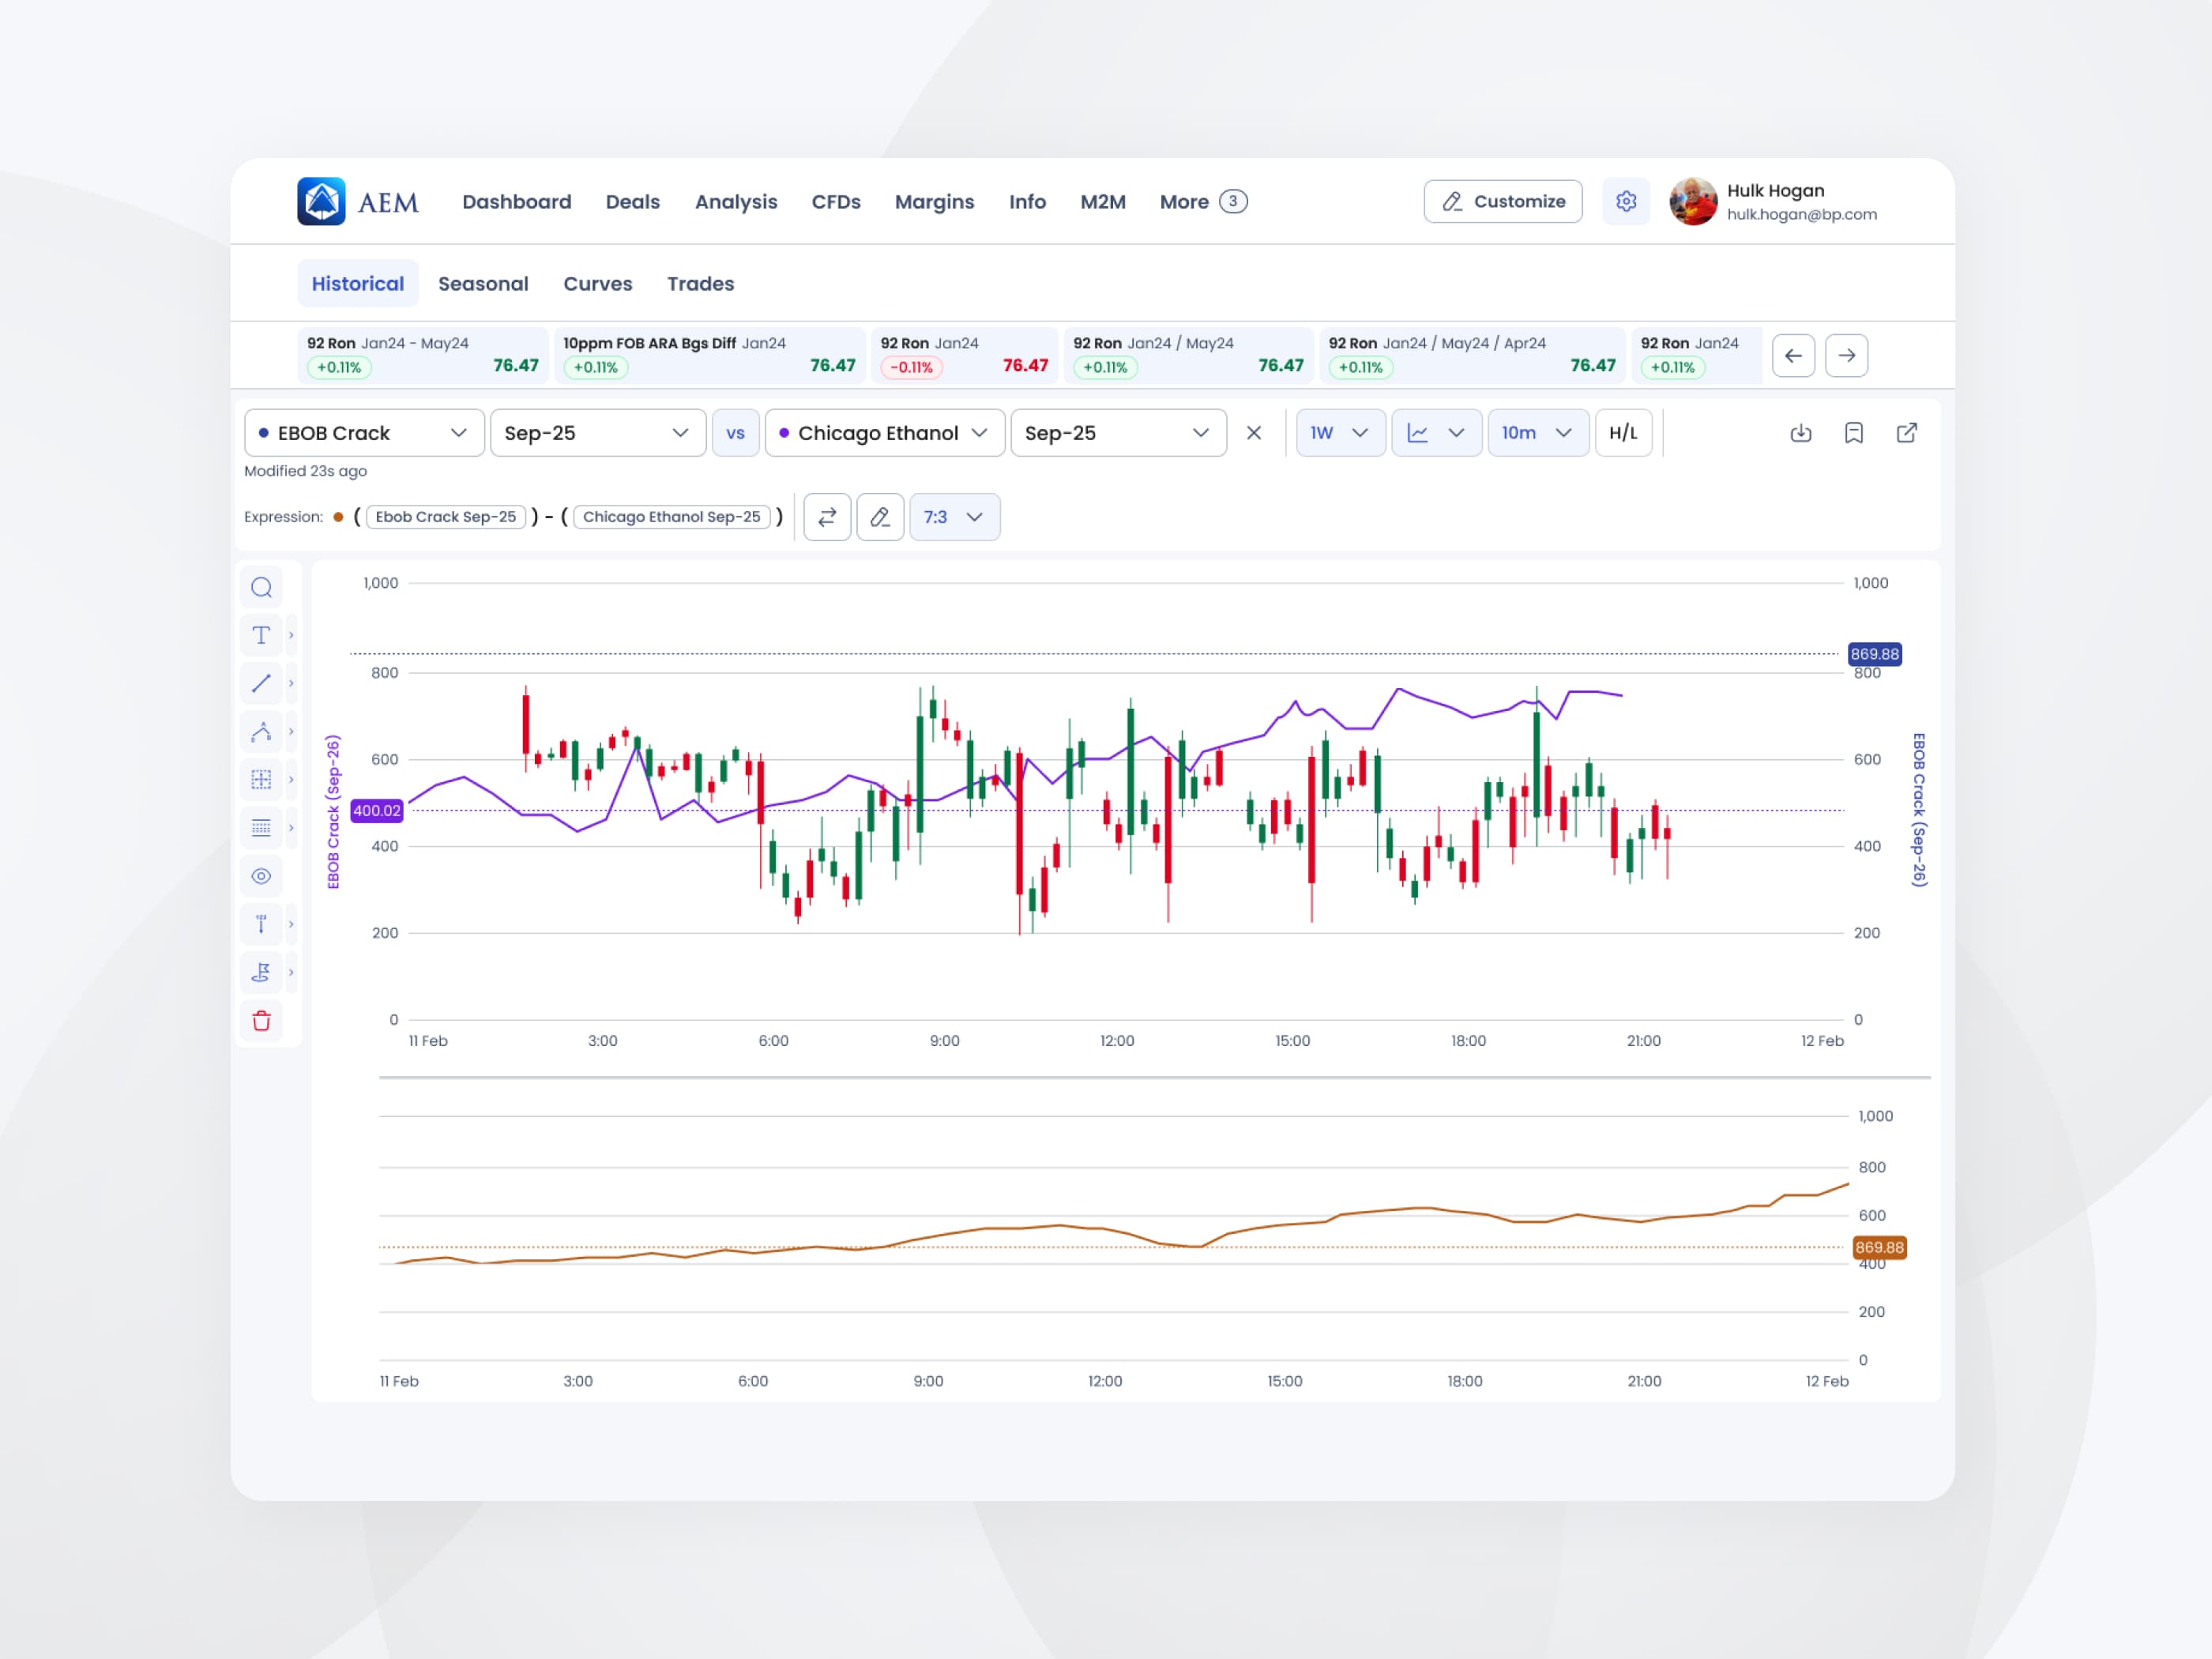
- The analytical suite
- Responding to trader requests for robust technical analysis, I designed a comprehensive analytical suite supporting a vast array of chart engines.
09
Advanced workflow automation & knowledge systems
The M2M feature set
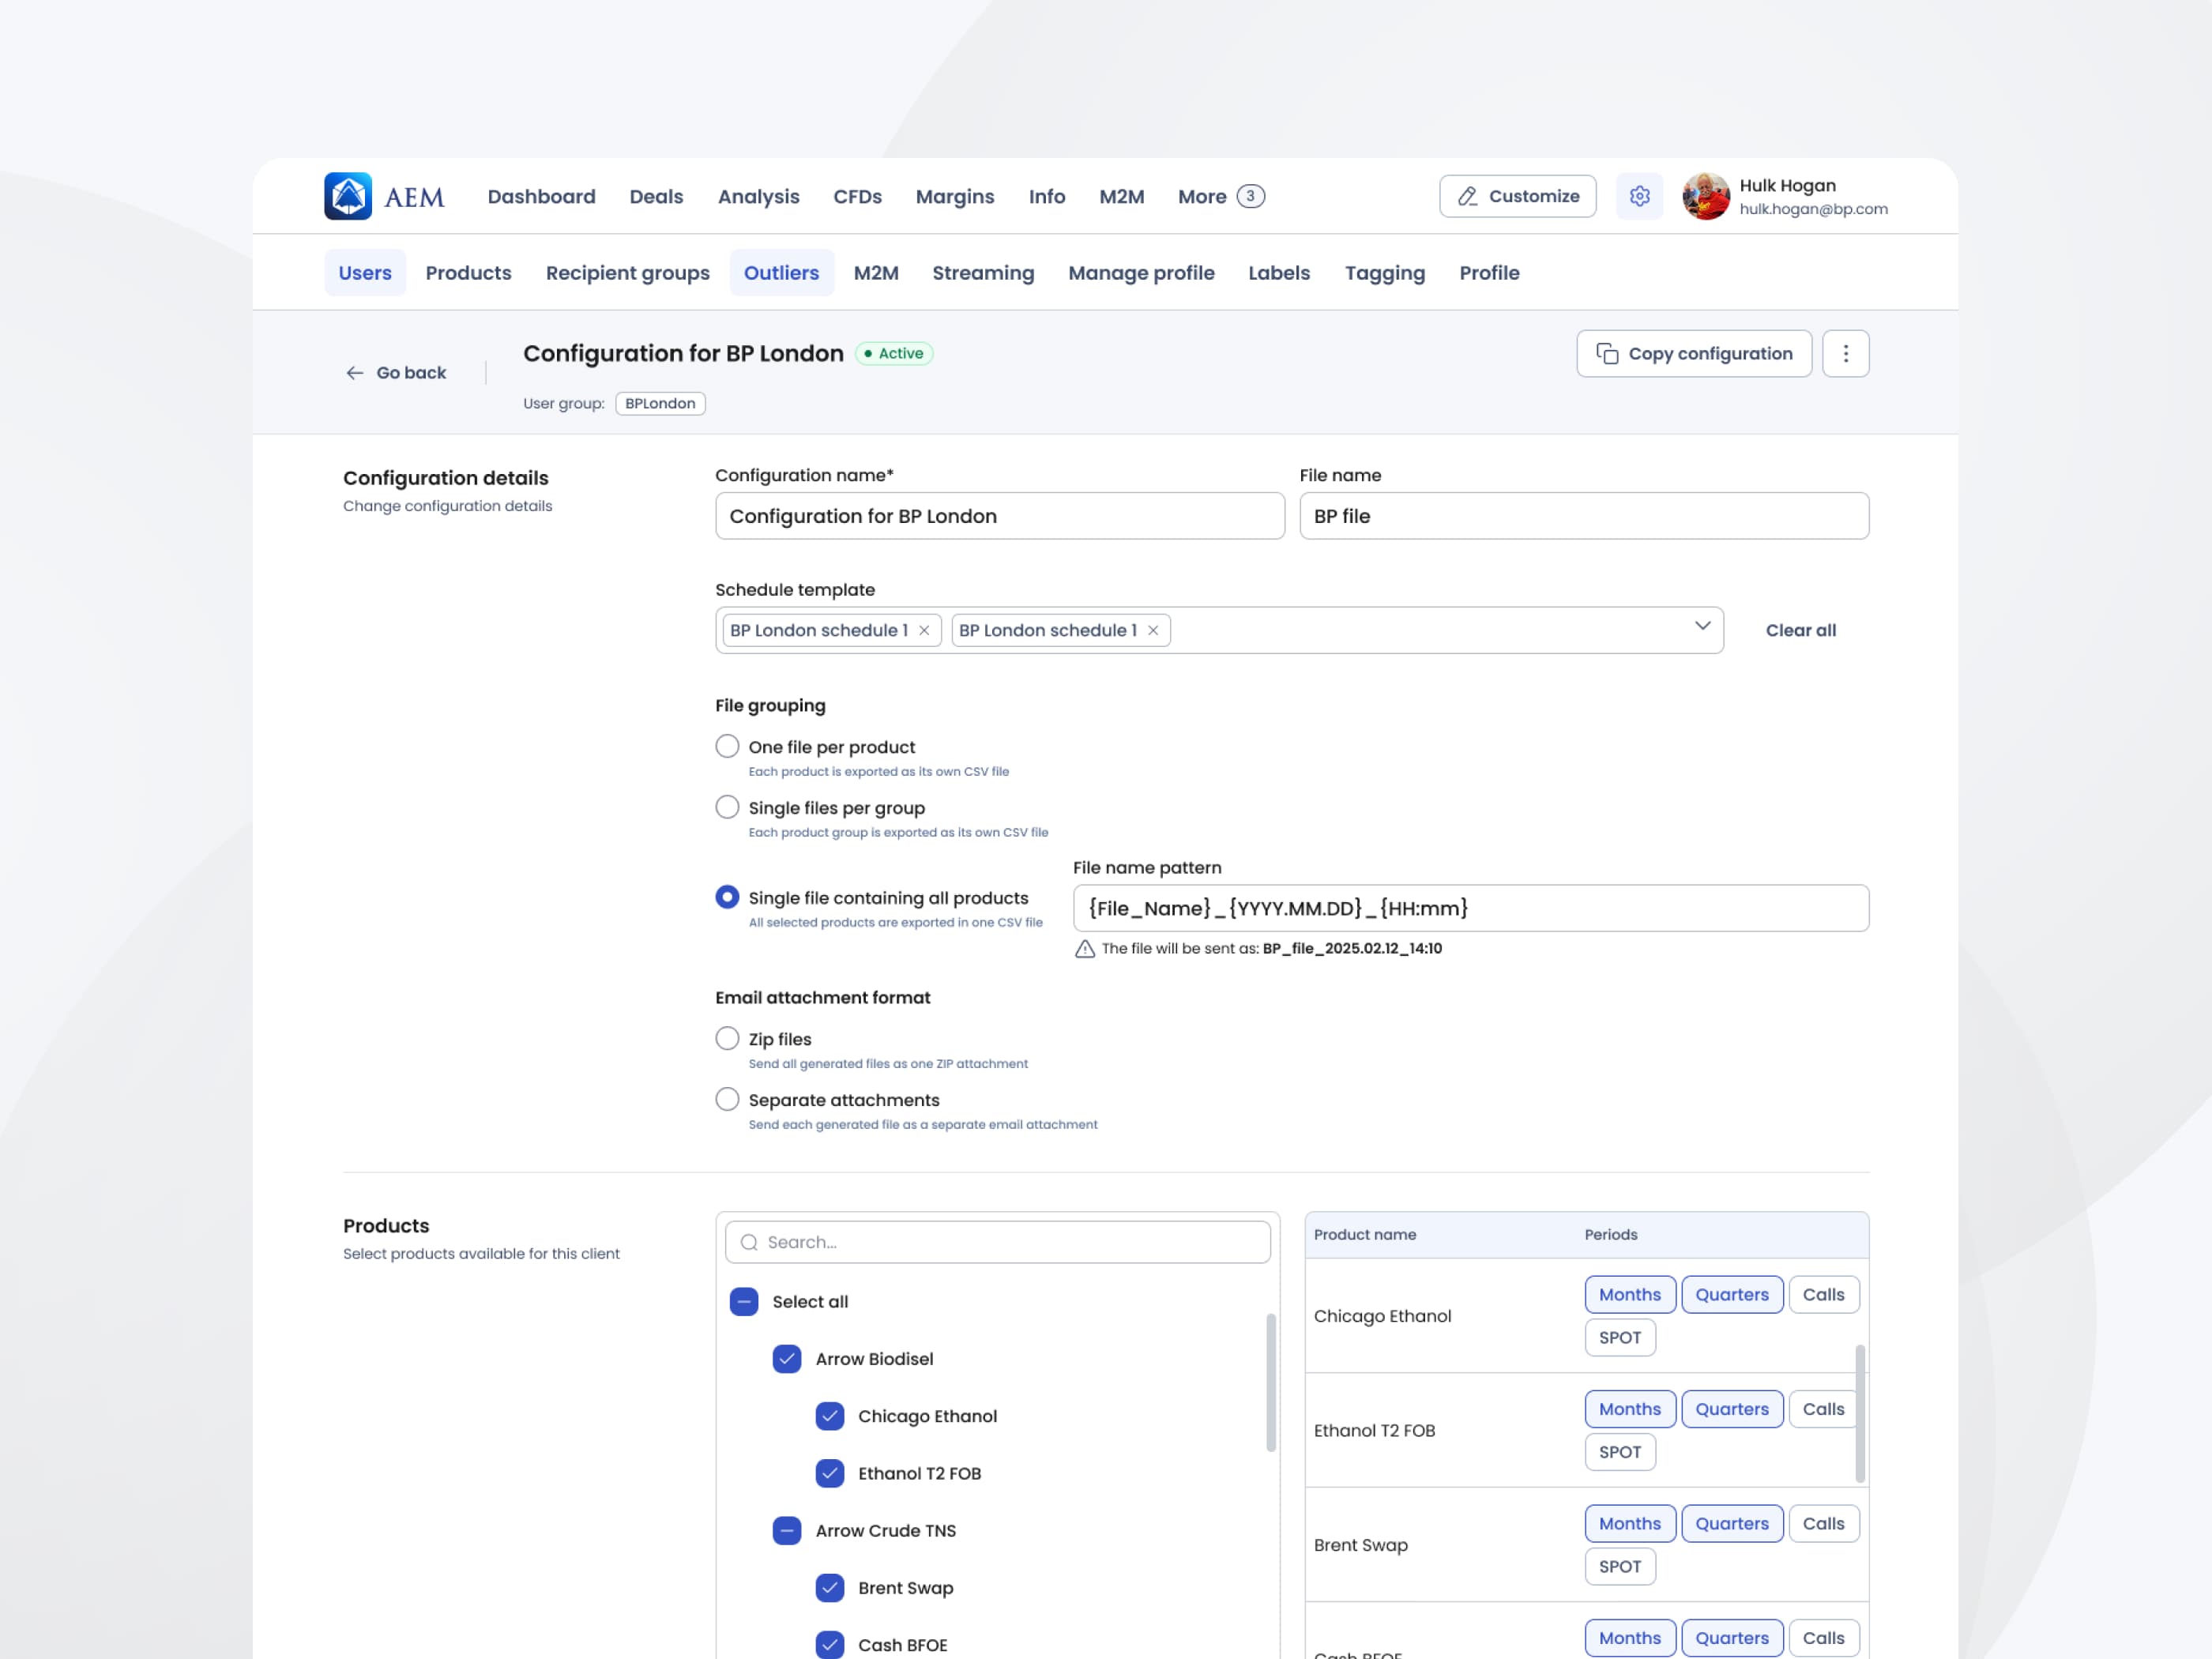
One of the most intricate additions was automating M2M (Mark-to-Market) data deliveries. The UX challenge lay in scheduling customization — one client requires payloads on the 10th of every month, another on the 15th. I drafted a comprehensive layout engine for scheduling configurations and data schema mapping, keeping end-users in the discovery loop throughout.
AI-powered knowledge management
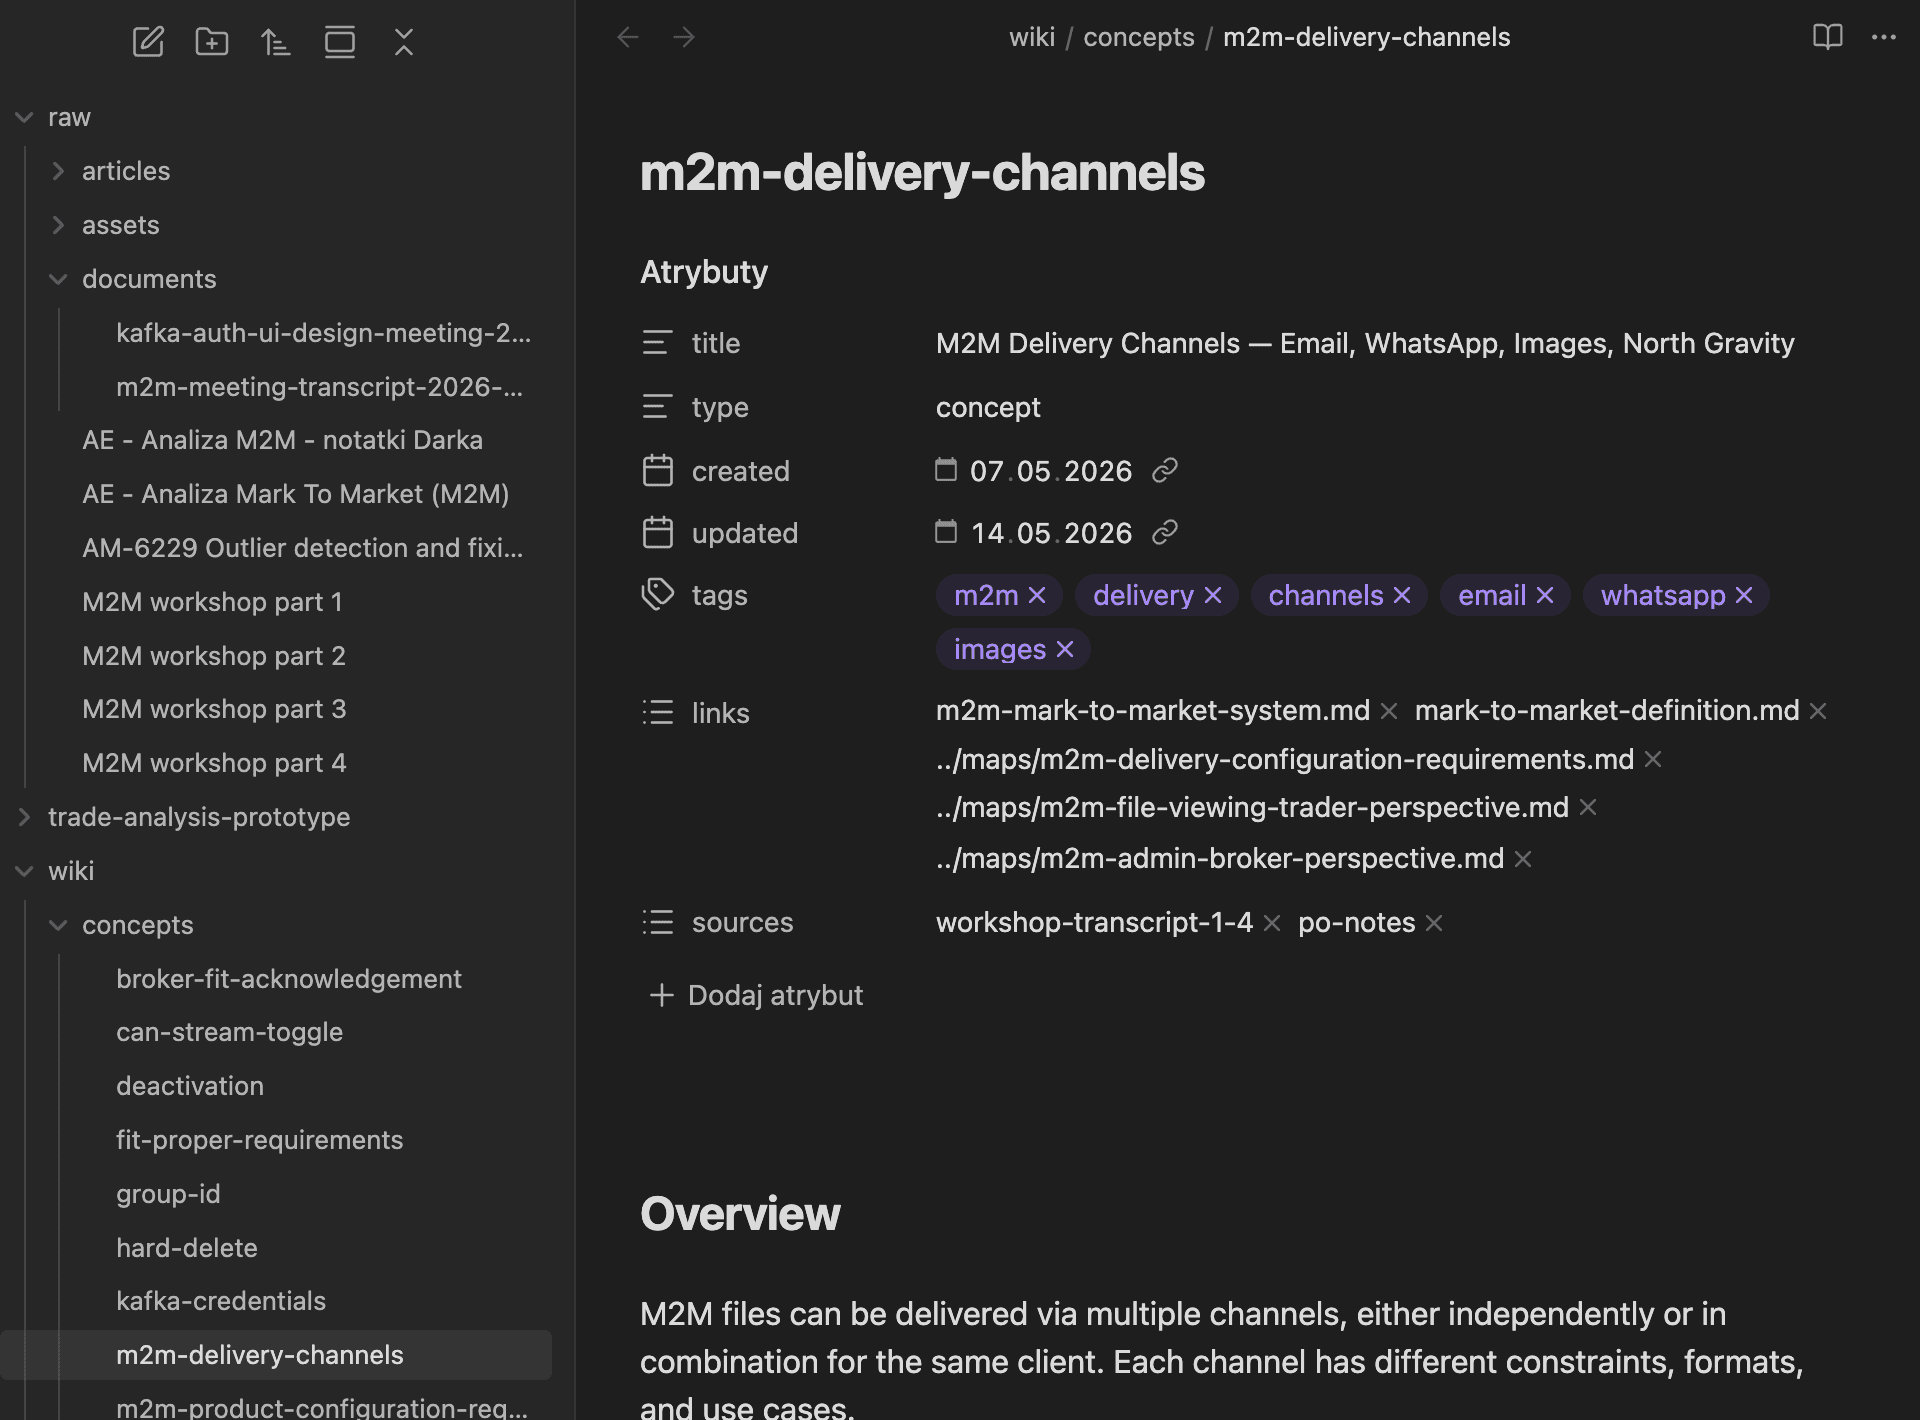
To manage the massive inflow of engineering constraints, workshop logs, and platform edge-cases over the years, I established a centralized local knowledge base using Obsidian, powered by Claude Code.
This AI-driven local workspace lets me search historical discovery files instantly, correlate product requirements with engineering limits, and verify that no critical functional parameters are lost when outputting hundreds of granular Figma component states.
10
Product metrics & business impact
The rollout of ATOM and the Client Portal brought measurable business and operational benefits — validating the commercial success of the entire AE Markets ecosystem.
~0%
Trade execution error rate
Down from up to 10% of deals misexecuted on the exchange. Brokers used to send complex formulas over WhatsApp, causing costly misinterpretations by the Middle Office — ATOM cut this to near zero, eliminating massive financial risk.
~500
Registered traders
Actively using the Client Portal analytical platform.
80
Average Daily Active Users
Steady daily engagement across the trader base.
Still evolving
And the work never stops — I continuously develop the product, analyze new requirements, and ship the next set of features.
Up next